EnviStats India 2025
- 06 Jun 2025
In News:
India's annual mean temperature rise up from 25.05°C in 2001 to 25.74°C in 2024, Electricity generation from renewable sources increased more than three times in 10 years.
- Released by: Ministry of Statistics and Programme Implementation (MoSPI) on June 5, 2025, on the occasion of World Environment Day
- Framework Used: UN's Framework for the Development of Environment Statistics (FDES 2013)
Key Highlights:
Climate Trends
- Annual Mean Temperature rose from 25.05°C (2001) to 25.74°C (2024).
- 2024 recorded as India’s hottest year since 1901; also, globally the hottest year in 175 years.
- Annual Minimum and Maximum Temperatures (2021–24):
- Minimum: 19.32°C → 20.24°C
- Maximum: 30.78°C → 31.25°C
Rainfall Patterns
- Rainfall shows seasonal concentration between June–September, with signs of shifting patterns such as late onset or extended rains into October.
- No clear long-term trend, reflecting erratic monsoonal behaviour.
Energy Generation
Thermal & Renewable Power (2013–14 to 2023–24)
- Thermal: 7.92 lakh GWh → 13.26 lakh GWh
- Renewable: 65,520 GWh → 2.25 lakh GWh, over 3x increase in renewable energy output in a decade.
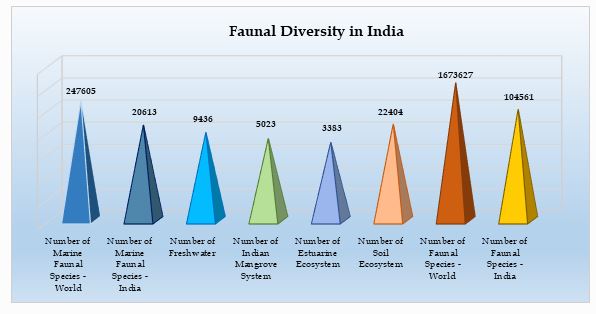
Biodiversity and Faunal Statistics
Faunal Diversity
- Global Faunal Species: 16,73,627
- India's Share: 1,04,561 species
- Habitat-specific Species in India:
- Soil Ecosystem: 22,404
- Freshwater Ecosystem: 9,436
- Mangrove System: 5,023
- Estuarine Ecosystem: 3,383
- Marine Fauna (India): 20,613 out of global 2,47,605
Fisheries Production
Inland vs. Marine Fish (2013–14 to 2023–24)
- Inland Fish Production: 61 lakh tonnes → 139 lakh tonnes
- Marine Fish Production: 34 lakh tonnes → 45 lakh tonnes
Public Expenditure (2021–22)
- Environment Sustainability Sector: ?2,433 crore (highest among sectors)
- Conservation of Natural Resources: Increasing trend
- Agro-Forestry: Lowest allocation
New Data indicators introduced
- Ramsar sites
- Access to sanitation
- Transport infrastructure
- Electricity access