Piprahwa Relics
- 02 Aug 2025
In News:
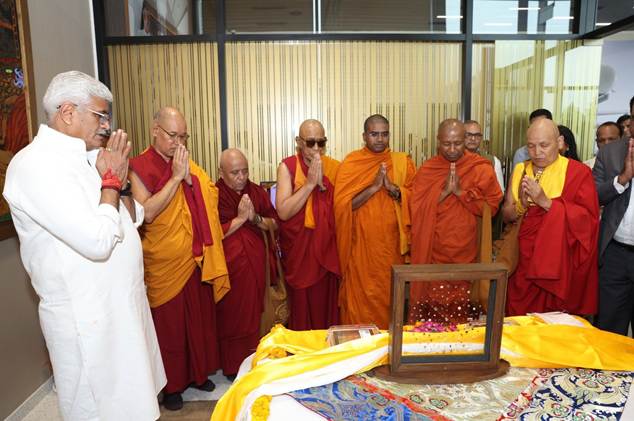
The recent return of the sacred Piprahwa relics of Lord Buddha to India marks a landmark moment in India’s cultural diplomacy, heritage preservation, and spiritual history. Orchestrated by the Ministry of Culture in partnership with the Godrej Industries Group, this event prevented the relics’ auction in Hong Kong (May 2025) and instead restored them to their rightful home. For India, the land where the Buddha attained enlightenment and preached, this repatriation is more than a matter of archaeology—it reaffirms India’s role as the civilizational custodian of global heritage.
What are the Piprahwa Relics?
- Association: Believed to be the mortal remains of Lord Buddha, enshrined by the Sakya clan (his kinsmen) in the 3rd century BCE.
- Discovery: Excavated in 1898 by William Claxton Peppé, a British civil engineer and estate manager, from a stupa at Piprahwa, Uttar Pradesh, located just south of Lumbini (Buddha’s birthplace, now in Nepal).
- Contents:
- Bone fragments of the Buddha
- Caskets: soapstone, crystal, and sandstone coffer
- Offerings: gold ornaments, gemstones, and other ritual objects
- Inscription: A Brahmi script engraving on one of the caskets confirmed the relics’ identity, noting they were deposited by the Sakya clan.
Historical Journey of the Relics
- Colonial Appropriation (1898–1899)
- Following their discovery, the British Crown claimed the artefacts under the Indian Treasure Trove Act, 1878.
- The bone and ash relics were gifted to King Chulalongkorn of Siam (Thailand), reflecting colonial practices of cultural transfer.
- The majority of the remaining relics were placed in the Indian Museum, Kolkata (1899).
- Legal Protection
- Classified as ‘AA’ antiquities under Indian law, these relics cannot be sold, exported, or removed—underscoring their sacred and national significance.
- Attempted Auction in 2025
- The relics resurfaced in Hong Kong for an intended auction.
- Through timely diplomatic and legal intervention, supported by public-private partnership with the Godrej Group, the Ministry of Culture secured their return.
Significance of the Repatriation
1. Spiritual and Cultural Significance
- Buddhism, which spread from India across Asia, regards relics of the Buddha as sacred embodiments of peace, compassion, and enlightenment.
- The return reaffirms India as the spiritual homeland of Buddhism, strengthening cultural linkages with Buddhist-majority nations like Thailand, Myanmar, Japan, and Sri Lanka.
2. Archaeological and Historical Importance
- Piprahwa is one of the earliest archaeologically verified stupa sites.
- The discovery provides rare material evidence of Buddhist practices of relic veneration, confirming textual accounts in Buddhist scriptures.
3. Diplomatic and Soft Power Dimensions
- The move highlights cultural diplomacy as a tool of India’s foreign policy.
- India positions itself as a global guardian of Buddhist heritage, enhancing ties with Southeast Asian nations where Buddhism is deeply rooted.
4. Model of Public–Private Partnership
- The collaboration between the Government of India and the Godrej Industries Group sets a precedent for safeguarding heritage.
- It reflects how corporate social responsibility (CSR) can extend beyond business to civilizational legacy.
Supply and Use Tables 2020–21 & 2021–22
- 02 Aug 2025
In News:
Recently, the Ministry of Statistics and Programme Implementation (MoSPI) released the Supply and Use Tables (SUTs) for 2020–21 and 2021–22.
What are Supply and Use Tables?
SUTs consist of two interlinked matrices—Supply Tables and Use Tables, organized in a product-by-industry format.
- Supply Table: Captures total supply of goods and services, combining domestic production (at basic prices) and imports.
- Use Table: Reveals how these products are used across the economy—intermediate consumption, final consumption, capital formation, and exports (at purchasers’ prices).
Purpose & Significance of SUT
- Integration of GDP Approaches: SUT unifies production, income, and expenditure methods for GDP calculation, helping reconcile discrepancies between them.
- Robust Analytical Tool: Offers granular insights into product-industry dynamics, facilitating better policymaking and economic analysis.
- Data Reconciliation: Aligns macroeconomic estimates from sources like National Accounts Statistics (NAS), ASI, RBI, EXIM data, and census, improving coherence.
Data Coverage & Compilation Methodology
- Scope: Covers 140 products and 66 industries, at current prices, aligned with UN’s System of National Accounts (SNA).
- Key Steps:
- Identify industries (via NIC, NAS compilation categories) and products (via NPCMS for manufacturing, NPCSS for services).
- Compile Supply Table at basic prices; translate to purchasers’ prices using tax, margin, and CIF adjustments.
- Compile Use Table, detailing intermediate and final uses.
- Balance product supply and use to ensure consistency.
- Data Sources: NAS, ASI, EXIM, RBI, CBIC, MCA, Cost of Cultivation, etc.
Key Highlights
|
Metric |
2020–21 |
2021–22 |
|
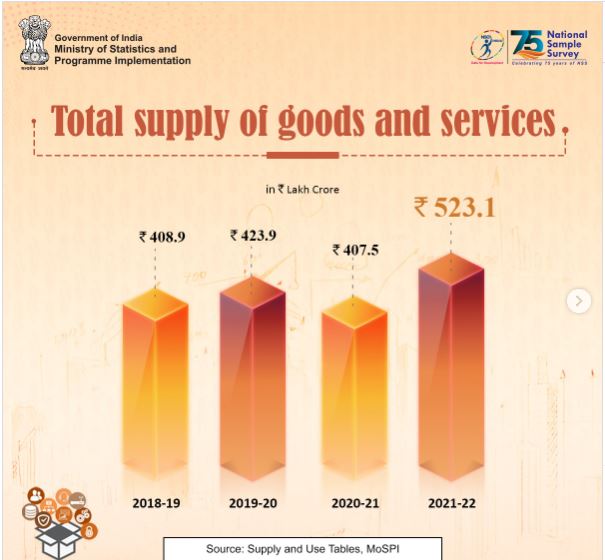
Total Supply (Purchasers’ Prices) |
?407.52 lakh crore |
?523.08 lakh crore |
|
Sectoral Composition (basic prices) |
Agriculture: 11–13%, Mining: 2%, Manufacturing: 30–33%, Manufacturing-related services: 3%, Other Services: ~55% |
GVA-to-GVO Ratios (Efficiency Indicators)
- Top-performing industries (high ratios):
- 2020–21: Ownership of Dwellings, Fishing & Aquaculture, Forestry & Logging, Agriculture, Education & Research
- 2021–22: Ownership of Dwellings, Fishing & Aquaculture, Forestry & Logging, Agriculture, Crude Petroleum
- Low-performing industries (low ratios):
- 2020–21: Meat processing, Dairy, Grain mill & animal feeds, Communication equipment, Other manufacturing
- 2021–22: Similar, with Coke & Refined Petroleum added
Consumption Patterns
- Intermediate Consumption: Highest share by Construction—13.82% (2020–21), 14.03% (2021–22).
- Consumption Composition:
- 2020–21: Intermediate: Goods 70%, Services 30%; PFCE: Goods 62%, Services 38%
- 2021–22: Intermediate: Goods 72%, Services 28%; PFCE: Goods 59%, Services 41%
GDP Discrepancy Reconciliation
- 2020–21: Discrepancy of –?2,46,154 crores; reconciled by reducing PFCE by ?3,05,628 cr; Inventory by ?18,897 cr; Imports by ?78,374 cr.
- 2021–22: Discrepancy of –?2,16,579 crores; PFCE cut by ?3,55,540 cr; Inventory by ?1,884 cr; Imports by ?1,37,081 cr.
Significance
- Macro-Accounting Sophistication:SUT represents India’s advanced approach to reconciling diverse economic indicators—critical for accurate GDP estimation.
- Policy Insights:Understanding sectoral efficiencies (via GVA-to-GVO), product dependencies, and consumption structures can guide targeted reforms.
- Post-Pandemic Recovery Landscape:The sharp increase in total supply (28.4% growth) between 2020–21 and 2021–22 reflects economic resilience and rebound.
- Data-Driven Governance: SUT’s transparency and granularity strengthen evidence-based policymaking.
- Statistical Infrastructure Evolution: Proposals for SME/MNE disaggregation, real-time dashboards, and annual updates align India with OECD’s extended SUT models and global best practices.
8.8-magnitude earthquakenear Russia’s Kamchatka Peninsula
- 02 Aug 2025
In News:
- Recently, a magnitude 8.8 megathrust quake struck off the eastern coast of Kamchatka Peninsula, one of the largest ever recorded globally.
- This quake ranks among the six strongest recorded since modern seismology began—comparable to events in Ecuador (1906) and Chile (2010)—but caused remarkably limited damage.
- It originated in the Kuril–Kamchatka subduction zone, where the denser Pacific Plate thrusts beneath the North American/Okhotsk plates—a region known for frequent tectonic activity. The rupture extended over 200–300 miles underwater.
Tsunami: Warnings, Impact, and Aftermath
- The quake triggered tsunami alerts across the Pacific: Japan, the U.S. West Coast, Alaska, Hawai‘i, Chile, Ecuador (Galápagos), and French Polynesia, among others, issued multi-national warnings.
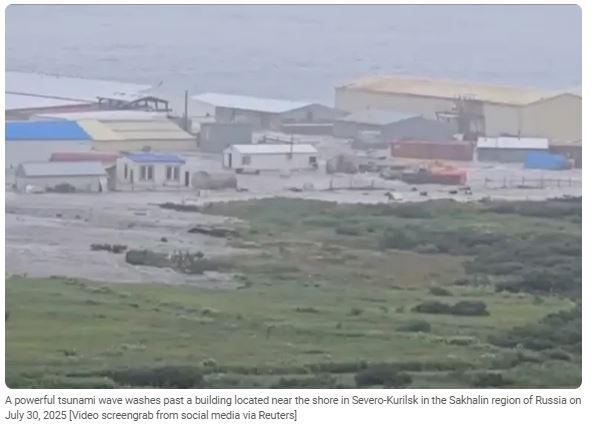
- In Kamchatka, waves between 3 to 5 meters struck, inundating the port and fish-processing plants in Severo-Kurilsk.
- Locally in Severo-Kurilsk, the quake caused serious structural damage to residential and social infrastructure, once again highlighting its vulnerability—especially recalling the catastrophic 1952 earthquake and tsunami that devastated the town.
Volcanic Aftermath: A Volcanic Chain Reaction
- In the quake’s wake, six volcanoes on Kamchatka became active. Most notably, Krasheninnikov erupted for the first time in 600 years, while others like KlyuchevskayaSopka, Shiveluch, Bezymianny, Karymsky, and Avachinsky also showed signs of eruption.
- This surge in volcanic activity—sparked by seismic fracturing of the crust—is considered a rare geological cascade, comparable to events last seen in 1737. Ash plumes reached up to 10 km height, posing aviation hazards.
Historical Perspective: Kamchatka’s Seismic Legacy
- 1952 Severo-Kurilsk Earthquake (Mag 8.8–9.0) caused a massive tsunami up to 18 meters, killing thousands and destroying the original town. It remains a defining tragedy in Russia’s seismic history.
- Earlier, the 1923 Kamchatka quake (Mag ~7–8) generated a tsunami that reached Hawaii and California’s coastlines, showing long-standing Pacific-wide impacts.
- These events underline the repeatable seismic vulnerability of the region and importance of preparedness.
India's Digital Payments Index

- 02 Aug 2025
In News:
The Reserve Bank of India’s Digital Payments Index (RBI-DPI), launched in January 2021, serves as a pivotal metric to gauge the country's journey toward a digital payments ecosystem. It uses March 2018 as its base year (index = 100) and is published every six months, offering a holistic and dynamic snapshot of digital transaction adoption.
RBI-DPI Calculation: Five Key Parameters
The DPI aggregates various dimensions of digital payments adoption across five weighted components:
|
Parameter |
Weightage |
Focus |
|
Payment Enablers |
25% |
Access infrastructure—mobile/internet penetration, Aadhaar, bank accounts, fintech regulations |
|
Demand-Side Infrastructure |
10% |
Consumer-facing tools—mobile/internet banking, debit/credit cards, FASTags |
|
Supply-Side Infrastructure |
15% |
Merchant tools—PoS terminals, ATMs, QR codes, bank branches, business correspondents |
|
Payment Performance |
45% |
Transaction metrics—volume/value of digital transfers, IMPS/NEFT/UPI usage, paper clearing |
|
Consumer Centricity |
5% |
User experience—awareness, complaint resolution, fraud handling, system uptime |
Drivers Behind the Mar 2025 Jump
As of March 2025, RBI-DPI stood at 493.22, up from 465.33 in September 2024—a year-on-year rise of 10.7%. The key drivers include:
- Supply-side Infrastructure Improvements: Wider merchant adoption of PoS, QR codes, and enhanced banking outreach.
- Payment Performance Surge: Rapid uptake of UPI, IMPS, and other platforms.
- Policy & Technology Boosters: Initiatives such as Digital India, increasing smartphone penetration, and fintech innovation have fueled demand.
Significance for Digital India
- Digital Economy Tracking: DPI is a quantitative barometer of India’s shift to a digital-first economy—enabling policymakers to monitor progress and identify gaps in access or infrastructure.
- Financial Inclusion & Transparency: Growth in DPI indicates deeper penetration of digital finance into rural and marginalized areas, helping combat cash reliance and promote inclusion.
- Policy Formulation & Monetary Insights: Metrics under Payment Performance bolster the RBI’s real-time understanding of transactional trends, aiding monetary policy and regulatory interventions.
- Enhancing Global Fintech Standing: A rising DPI strengthens India’s position as a global digital finance hub, enhancing credibility and attracting investment.
Challenges & Recommendations Ahead
- Digital Divide: Rural areas still lack adequate connectivity and awareness to fully utilize digital tools.
- Cybersecurity & Fraud: As transactions rise, so do risks. Issues like fraud, system downtime, and grievance redressal remain priorities.
- Tech Standardization: Ensuring interoperability and unified standards across platforms is essential.
Schengen Visa Cascade Regime
- 02 Aug 2025
In News:
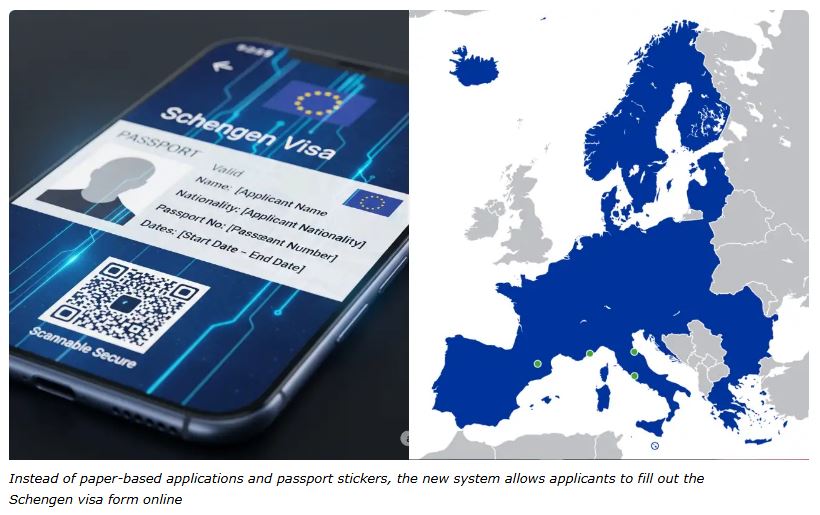
Since 18 April 2024, the European Commission implemented a preferential “cascade” regime under the revised Schengen Visa Code (2020 reform), offering long-term, multiple-entry Schengen visas to Indian nationals with a clean travel history. Originally effective for India, Turkey, and Indonesia, this regime could expand to other countries based on diplomatic and readmission cooperation.
What Is the Schengen Area & Visa Basics
- The Schengen Area comprises 29 countries, including most EU members and four EFTA nations—allowing passport-free movement.
- A Schengen (short-stay) visa permits up to 90 days within any 180-day period. It is purpose-flexible (tourism, business, visiting family, etc.) but does not confer work rights.
The Cascade Regime – A Tiered System
Tier-Based Progression
The regime introduces a pyramid-like progression based on prior visa use:
|
Tier |
Requirement |
Visa Validity |
|
Entry-level |
First-time or minimal travel history |
Short-term, single-entry (probationary) |
|
Tier 1 |
Used three Schengen visas in the past 2 years |
1-year multiple-entry |
|
Tier 2 |
Held and lawfully used a 1-year multiple-entry visa in the past 2 years |
2-year multiple-entry |
|
Tier 3* |
Used a 2-year multiple-entry visa in the past 3 years |
5-year multiple-entry |
*Availability of the 5-year visa depends on passport validity.
Underlying Rule
Mexico’s 90/180 rule still applies: holders can stay only up to 90 days within any rolling 180-day period.
What's Special for Indian Nationals
- The cascade regime for Indians is more favorable than the general rule (which typically demands three prior visas within 2 years for progression). Indians now qualify for a 2-year visa with just two prior visas within 3 years, thanks to a special provision under Article 24(2c) of Regulation (EC) No 810/2009.
- The visa must not exceed passport validity—if the passport expires earlier, the visa has to be correspondingly shorter.
- The policy is discretionary—granting long-term visas (especially 5-year ones) depends on the visa officer’s judgement, even if eligibility criteria are technically met.
Strategic and Policy Significance
- People-to-people diplomacy: The cascade visa fosters cultural, business, and academic exchange, aligning with the EU's emphasis on soft power and deepening ties with India.
- Bilateral alignment: Reflects the EU-India Common Agenda on Migration and Mobility, and dovetails with negotiations around the India–EU Free Trade Agreement (FTA).
- Administrative efficiency: Long-term visas reduce repeat applications—beneficial for both visa applicants and consular resources.
- Reciprocity and expansion: Initially for India, Turkey, and Indonesia; the regime may expand to more countries based on cooperation levels.