World Inequality Report 2026
- 14 Dec 2025
In News:
The World Inequality Report 2026, released by the World Inequality Lab, highlights widening disparities in income, wealth, gender earnings, and climate responsibility. India is identified as one of the countries with high concentration of income and wealth at the top.
Global Inequality Trends
- Top 10% of the global population own 75% of total wealth
- Bottom 50% own just 2%
- Top 1% alone control 37% of global wealth, nearly 18 times more than the bottom half of humanity combined
- The ultra-rich (top 0.001%) hold more wealth than billions at the bottom
Gender Inequality
- Women earn 61% of men’s income per working hour (excluding unpaid work)
- Including unpaid care work, this falls to 32%
- Women receive only 26% of global labour income, largely unchanged since 1990
Regional Gender Gaps
- Middle East & North Africa: 16% share of labour income
- South & Southeast Asia: 20%
- Sub-Saharan Africa: 28%
- East Asia: 34%
- Europe/North America/Oceania: ~40%
Climate Inequality
Economic inequality overlaps with environmental injustice:
- Poorest 50% contribute only 3% of carbon emissions linked to private capital
- Top 10% responsible for 77%
- Top 1% alone account for 41%, nearly double the emissions of the bottom 90%
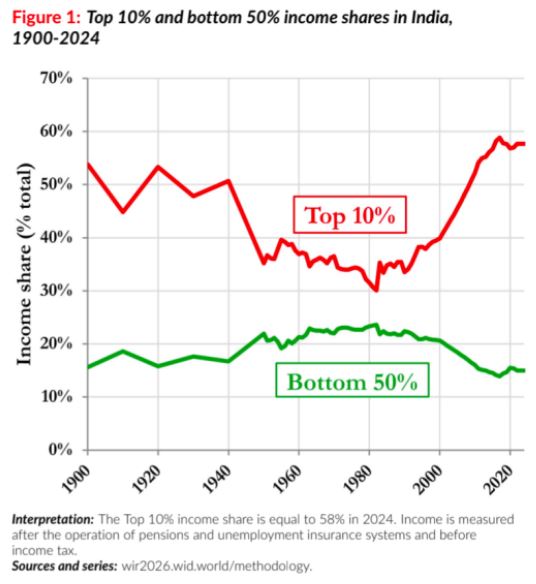
Income Inequality in India
- Top 10% earn 58% of national income
- Bottom 50% receive only 15%
- Female labour income share in India is just 18%, below global average
Wealth Inequality in India
Wealth disparity is even sharper than income inequality:
- Top 10% hold 65% of total wealth
- Top 1% control 40%
- Bottom 50% own less than 6%
Changing Global Economic Geography
1980
- Global elite concentrated in North America & Europe
- India and China largely in the bottom income groups
2025
- China’s population has moved upward into middle and upper-middle income groups
- India’s population remains heavily concentrated in the bottom half of the global distribution
Policy Failures Highlighted
- Ultra-rich often pay lower effective tax rates than middle-income groups
- Regressive tax systems weaken state capacity for:
- Education
- Healthcare
- Social protection
- Climate action
Key Recommendations of the Report
- Progressive Taxation – Higher contributions from the wealthy
- Public Investment – Universal education, healthcare, childcare, nutrition
- Redistributive Measures – Cash transfers, pensions, unemployment benefits
These policies are essential to reduce structural inequality and build inclusive growth.