The Persistent Challenge of Counterfeit Indian Currency: A Post-Demonetisation Analysis

- 11 May 2026
In News:
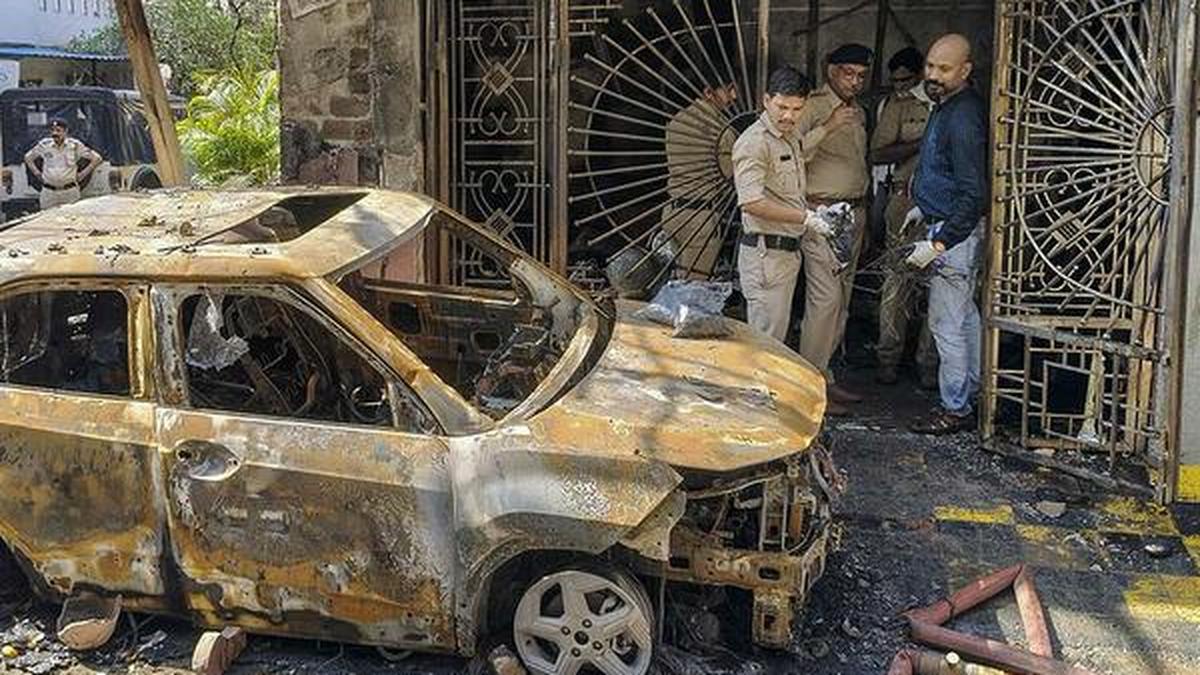
Nearly a decade after the 2016 demonetisation—a move partially aimed at purging the economy of fake notes—the latest ‘Crime in India’ report 2024 reveals that counterfeit currency remains a potent threat to India’s economic sovereignty. With over ?54.61 crore in fake notes seized in 2024 alone, the challenge has evolved from simple photocopies to sophisticated imitations of the Mahatma Gandhi (New) Series.
The Scale of the Crisis: Key Data and Trends
Despite a significant push toward a "less-cash" economy, the appetite for physical tender in India remains high, providing a fertile ground for Counterfeit Indian Currency Notes (CICN).
- Surge in Currency in Circulation (CiC): As of May 2026, CiC has skyrocketed to ?42.12 lakh crore, a 137% increase from the ?17.74 lakh crore recorded in November 2016.
- Seizure Statistics: Between 2017 and 2024, law enforcement agencies seized fake currency worth ?638 crore. The year 2022 marked a significant peak with seizures totaling ?382.6 crore.
- Denomination Shift: The ?500 note has emerged as the "workhorse" for counterfeiters. Detection of fake ?500 notes in 2024 was four times higher than in 2016, suggesting that the security features of the new series have been successfully replicated by organized syndicates.
- Geographic Hotspots: Gujarat has emerged as the primary epicenter, accounting for over 50% of the country’s total seizures (?355.72 crore) since 2017. Other major trade hubs like Maharashtra and Karnataka also report high detection rates due to high-volume cash transactions.
Factors Fueling the Counterfeit Trade
The persistence of CICN is driven by a combination of technological advancement and geopolitical vulnerabilities.
- Advanced Replication Technology: Criminal networks now utilize high-grade printing technology to mimic complex security features, such as color-shifting ink, latent images, and micro-lettering.
- Cross-Border Smuggling: Hostile neighbors and international crime syndicates exploit porous borders to pump "Super Notes" into the economy. Traditional transit routes in the North East and the "Three Frontiers" remain active conduits for high-quality fakes.
- The "Incapacity" of Rural Markets: Organized gangs often target MSMEs and rural markets where manual verification is the norm. The lack of UV-detection lamps in these areas makes it easier to circulate fake ?500 bills.
Multi-Dimensional Implications
The proliferation of fake currency extends far beyond mere financial loss; it strikes at the heart of national security and public trust.
- Economic Instability: By increasing the money supply without a corresponding increase in goods or services, fake currency acts as a catalyst for inflation and devalues the purchasing power of the common citizen.
- Terror Financing: There is a well-documented nexus between CICN and the financing of domestic insurgency and proxy wars. Investigative agencies frequently link large-scale seizures to active terror modules.
- Erosion of Public Confidence: The detection of over 11 lakh fake notes within the formal banking system creates public panic and undermines faith in the national tender.
- Fiscal Burden: The state incurs massive costs in frequently updating security features and the physical destruction of detected fakes. The 2023 withdrawal of ?2,000 notes was partly a strategic move to mitigate long-term counterfeiting risks.
Challenges in Enforcement
The "Technological Race" between the Reserve Bank of India (RBI) and counterfeiters is constant. Within a year of the 2016 demonetisation, fake versions of the "un-counterfeitable" ?2,000 note had already surfaced. Furthermore, enforcement is often hampered by fragmented data silos between state police forces, the National Crime Records Bureau (NCRB), and central agencies like the National Investigation Agency (NIA).
Way Ahead: A Strategic Roadmap
To safeguard the integrity of the Indian Rupee, a multi-pronged approach is required:
- Periodic Security Overhauls: The RBI should consider introducing advanced features like polymer notes or holographic threads every few years to stay ahead of the replication curve.
- Inter-Agency Synergy: Empowering the National Functional Analysis Centre to provide real-time, district-level data to state police can bridge the current information gap.
- "Know Your Note" Campaigns: Targeted awareness drives in rural and border areas, utilizing mobile apps and visual aids, can empower citizens to perform primary verification.
- Digital Incentivization: Lowering transaction costs for MSMEs will reduce the total volume of high-value cash in circulation, thereby shrinking the space available for fake notes to hide.
Conclusion:
The reality of post-demonetisation India confirms that structural shocks alone cannot eliminate counterfeiting. It requires a continuous evolution of security standards and aggressive digitization. Protecting the Rupee is not just an economic necessity but a vital component of India’s national security architecture.
From Policy to Practice: The Evolution of Localized Climate Governance and Heat Action in India

- 10 May 2026
In News:
India is witnessing a significant paradigm shift in climate governance. As the nation faces intensifying heatwaves and extreme weather events, the focus is moving away from generic, top-down State Action Plans on Climate Change (SAPCCs) toward localized, data-driven, and enforceable strategies. This transition is most visible in the evolution of Heat Action Plans (HAPs), which are being reimagined not just as emergency advisories, but as mandatory regulatory frameworks integrated into urban planning and disaster management.
The Foundation: State Action Plans on Climate Change (SAPCCs)
Originating from the National Action Plan on Climate Change (NAPCC) 2008, SAPCCs serve as the primary policy framework for Indian States and Union Territories. They provide a "sub-national" lens to climate action, recognizing that the challenges faced by a coastal state like Odisha differ fundamentally from those of a mountainous state like Himachal Pradesh.
Key Focal Sectors of SAPCCs:
- Agriculture & Water: Developing climate-resilient crops and enhancing groundwater recharge.
- Health & Urban Habitat: Monitoring heat-related illnesses and promoting sustainable public transport and energy-efficient buildings.
- Biodiversity: Expanding green cover to act as carbon sinks and protecting local ecosystems.
The Strategic Shift: From Generic to Localized Governance
Despite the existence of SAPCCs, the first generation of plans often remained broad and lacked actionable precision. Current efforts are focusing on "institutionalizing" climate action through specific, state-led innovations:
- Innovative Climate Financing: States like Odisha have pioneered climate budgeting, while Tamil Nadu established the Tamil Nadu Green Climate Company (TNGCC) in 2024—a nodal agency with a ?1,000-crore corpus dedicated to climate action.
- Data-Driven Policy Platforms: The PM Surya Ghar portal and the Revamped Distribution Sector Scheme provide real-time data on solar adoption and power infrastructure, allowing policymakers to identify regional gaps and refine strategies with surgical precision.
- Institutional Accountability: Local bodies are adopting "responsibility matrices." For instance, Thane’s heat task force requires environment departments to present annual progress reports to State Assemblies, ensuring that plans lead to measurable on-ground results.
Bridging the Gap: Moving Heat Action Plans (HAPs) to Mandates
While over 23 states have developed HAPs, most remain non-binding advisories. This "lack of teeth" often leads to reactive rather than proactive measures. Recent discourse, highlighted by experts and the 16th Finance Commission, emphasizes the need for a regulatory shift.
The Urban Heat Island (UHI) Challenge
In cities like Chennai, the UHI effect can make urban centers 3–5°C warmer than surrounding rural areas. Commercial zones, like Chennai’s T. Nagar, illustrate a vicious cycle: air conditioning units blast hot air into the streets to cool interiors, further warming the outdoor environment and increasing heat stress for outdoor workers and the elderly.
The Path to Mandatory HAPs:
To move from advisories to mandates, climate governance must integrate the following:
- Legal Enforcement: Transitioning HAPs into legally enforceable codes, such as making "cool roof" technologies mandatory for commercial buildings and high-rise developments.
- National Disaster Status: The recommendation to declare heatwaves as a nationally notified disaster would unlock federal funding for city-level resilience, moving beyond the current reliance on limited municipal budgets.
- Localized Vulnerability Mapping: Instead of city-wide alerts, municipal agencies should conduct ward-wise vulnerability mapping to prioritize interventions for the socio-economically marginalized.
- Infrastructure Adaptation: Mandating minimum urban tree cover ratios, shaded public rest areas, and dedicated water distribution networks for heat emergencies.
Economic and Social Imperatives
The transition is not merely environmental but economic. The International Labour Organization (ILO) estimates that India could lose 5.8% of its total working hours—equivalent to 34 million full-time jobs—to heat stress by 2030, with agriculture and construction being the hardest hit.
Conclusion
The future of India’s climate resilience lies in the successful merger of the broad vision of SAPCCs with the granular, mandatory execution of localized plans. By institutionalizing climate finance, leveraging real-time data, and granting HAPs legal standing, India can transform its climate strategy from a reactive policy exercise into a proactive shield for its citizens and economy.
The Precarious City: Navigating the Crisis of India’s Urban Informal Workforce

- 24 Apr 2026
In News:
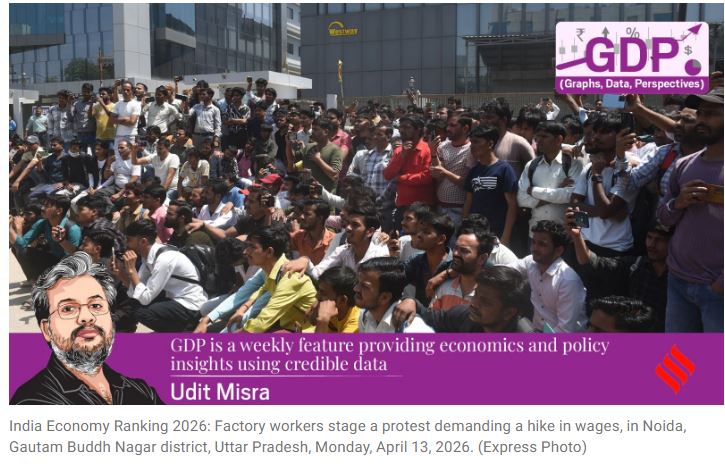
Recent worker protests in industrial hubs like Noida have once again brought to the fore the structural vulnerabilities of India’s informal sector. As urban centers transition from traditional industrial hubs to survival-oriented service spaces, the informal workforce—comprising nearly 90% of India’s total labor force—faces an existential crisis characterized by economic exclusion and spatial marginalization.
The Informal Sector: Scope and Economic Significance
The informal sector encompasses economic activities that function outside the ambit of formal regulatory and institutional frameworks. It is a heterogeneous mix including self-employed individuals, daily wage laborers, street vendors, and unregistered micro-enterprises.
- Dominance in Livelihood: Despite the push for formalization, the informal sector remains the backbone of the Indian economy. Even in urban landscapes, formal salaried positions are scarce, leaving the majority of migrants and residents dependent on unstable, low-paying work.
- Structural Vulnerabilities: These workers typically lack written contracts, job security, and any form of institutional social protection. This makes them the first victims of economic shocks, as seen during global pandemics or local industrial downturns.
The Urban Shift: From Production to Survival
India’s urban economic structure is undergoing a profound transformation. The decline of large-scale formal industries—symbolized by the historical closure of textile mills in Mumbai and Ahmedabad—has led to a fragmented labor market.
- The Survival Economy: Cities are increasingly becoming spaces for "social reproduction" rather than industrial production. This means the urban economy is now focused on basic survival needs like housing, food, and low-end services.
- Spatial Marginalization: Approximately 40% of the urban poor live in slums or informal settlements. These areas often lack basic sanitation and legal recognition, forcing workers into hazard-prone environments.
- The Rent Trap: A significant portion of an informal worker's income—often up to 50%—is consumed by rent in these precarious settlements. This leaves little for nutrition, health, or education.
Key Challenges and Policy Gaps
Despite its scale, the informal sector suffers from systemic neglect in urban planning and financial policy.
- Privatization of Essentials: Economic reforms have shifted the state’s role from a service provider to a market facilitator. The resulting privatization of water and electricity has increased the cost of living for those least able to afford it.
- Financial Exclusion and Debt: Lacking collateral, workers are often shunned by formal banking systems. This forces them into the clutches of local moneylenders, leading to a cycle of chronic indebtedness.
- Low Bargaining Power: The fragmented nature of urban labor prevents collective bargaining, leaving workers at the mercy of volatile market demands and predatory middle-men.
Institutional Response and Government Initiatives
The government has launched several flagship initiatives to bridge the formal-informal divide:
- Code on Social Security (2020): A legislative attempt to extend life and disability insurance, maternity benefits, and old-age protection to unorganized workers.
- e-Shram Portal: A national database of unorganized workers designed to facilitate better policy targeting and the seamless delivery of welfare benefits.
- PM SVANidhi: A micro-credit scheme providing collateral-free working capital loans to street vendors to help them resume livelihoods post-disruption.
However, challenges such as digital illiteracy, complex registration processes, and implementation bottlenecks at the local level continue to hinder the reach of these schemes.
The Way Ahead: Towards Inclusive Urban Governance
To address the precariousness of urban labor, a shift in governance philosophy is required:
- Integrating Workers into Governance: Moving beyond top-down policies, cities need inclusive structures such as workers’ councils. These platforms allow informal workers to participate in urban decision-making and advocate for their rights.
- Securing Housing and Services: Urban planning must prioritize affordable housing and protected access to essential services to reduce the "survival cost" of city life.
- Formalization with Protection: While formalizing the economy is a long-term goal, the immediate priority must be providing a "social floor"—a minimum level of social security that stays with the worker, regardless of their employment status.
Conclusion
The protests in Noida are a symptom of a deeper malaise in India’s urban growth story. A truly "Viksit Bharat" (Developed India) cannot be built on the back of an invisible and exploited informal workforce. Recognizing the informal sector not as a transient phase but as a permanent, vital part of the urban fabric is the first step toward creating resilient and inclusive cities.
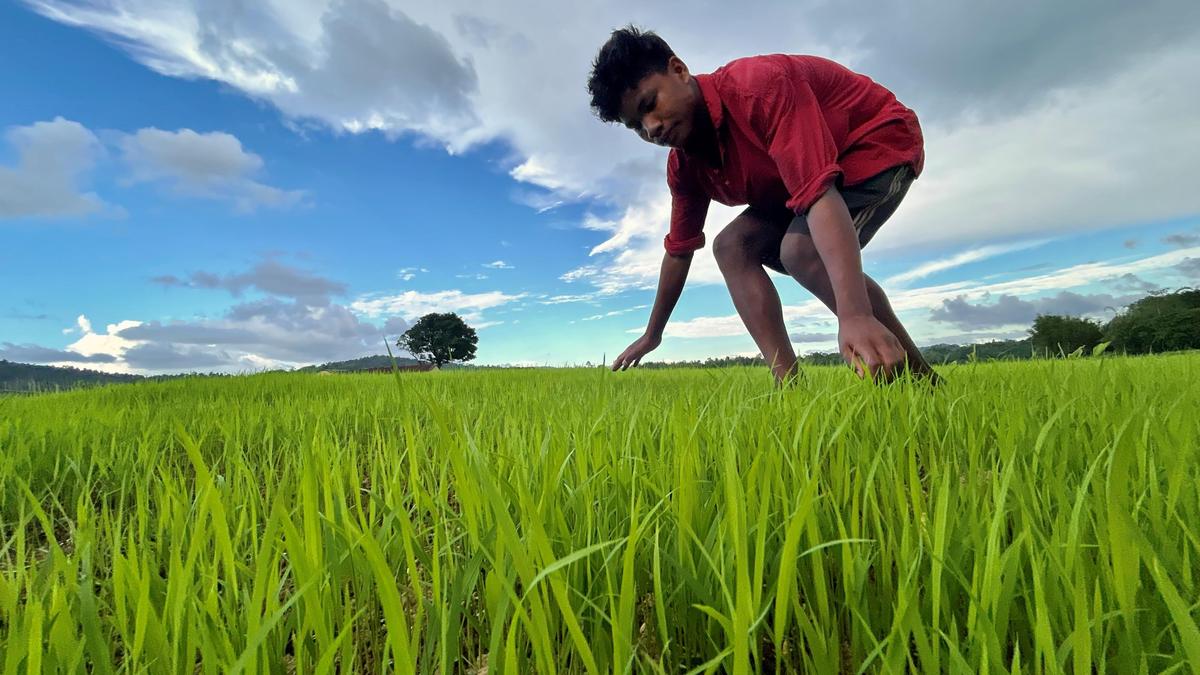
Harvesting Value: India’s Strategic Shift to High-Value Crop Diversification
- 22 Apr 2026
In News:
The Union Budget 2026-27 marks a watershed moment in Indian agriculture, moving away from a cereal-centric approach toward a regionally differentiated strategy for High-Value Crops (HVCs). By focusing on the unique agro-climatic strengths of the coastal, North Eastern, and Himalayan belts, the government aims to transform farmers from subsistence growers into global agri-entrepreneurs.
Understanding High-Value Crops (HVCs)
High-value crops include horticultural produce such as fruits, vegetables, spices, medicinal plants, and aromatic woods. They are "high value" because they yield significantly higher net returns per hectare compared to staples like paddy or wheat.
Horticulture: The New Economic Nucleus
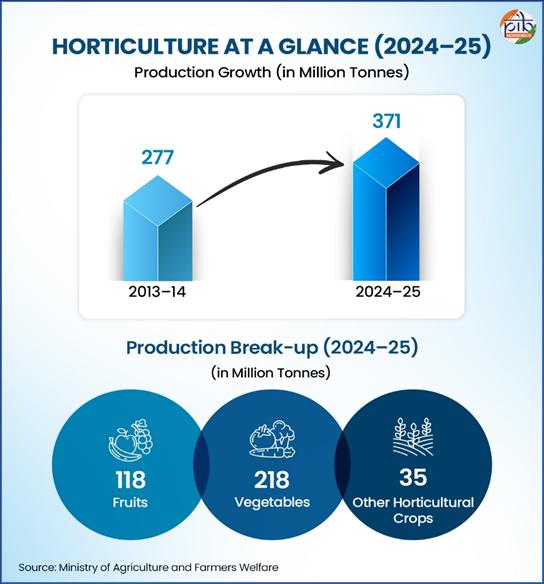
- GVO Contribution: Horticulture now accounts for approximately 37% of the Gross Value Output (GVO) within the agricultural crops sub-sector.
- Growth Trajectory: With a growth rate of 4.45% over the last decade, horticulture is the fastest-growing segment of Indian agriculture.
- Global Leadership: India is the world’s largest producer of onions and shallots (22.42% global share) and ranks second globally in the production of vegetables, fruits, and potatoes.
- Output Milestone: Total horticultural production reached a record 370.74 million tonnes in 2024-25.
Regionally Anchored Diversification Strategies
The 2026-27 strategy leverages specific geographic advantages to maximize export potential:
1. The Coastal Frontier (Coconut, Cashew, Cocoa)
- Coconut: India is the world’s second-largest producer, supporting 30 million livelihoods. The focus is on replacing senile (aging) plantations with high-yielding varieties.
- Cocoa Intercropping: To optimize land use, cocoa is being promoted as an intercrop in coconut and arecanut groves, utilizing the 40-50% sunlight penetration that otherwise goes to waste.
- Export Value: In 2024-25, cashew and cocoa exports combined for a staggering USD 664.75 million.
2. The North Eastern Hub (Agarwood & "Oud")
- Agarwood Dominance: India hosts 150 million agarwood trees, with 90% in the North East.
- Economic Potential: Tripura alone targets an annual turnover of ?2,000 crore by tapping into the global luxury fragrance (Oud) market, aligned with CITES export quotas.
3. The Himalayan and Hilly Regions (Nuts and Fruits)
- High-Density Cultivation: Promoting high-density orchards for Walnuts, Almonds, and Chilgoza (Pine nuts) in Jammu & Kashmir and Himachal Pradesh to double tribal incomes and leverage the high demand for dry fruits.
The Multi-Dimensional Impact of Diversification
- 5F Framework Alignment: The strategy supports the Farm-to-Foreign chain, ensuring value addition at every step.
- Employment Generation: HVCs are labor-intensive, creating year-round employment in rural areas, particularly for women and tribal communities.
- Nutritional Security: Diversification improves the availability of micro-nutrients, addressing hidden hunger.
- Agro-Processing Linkages: HVCs provide the raw materials for a booming food processing industry, including virgin coconut oil, fermented cocoa, and spice extracts.
Structural Challenges and Roadblocks
Despite the potential, the transition faces several hurdles:
- Perishability & Infrastructure: Horticultural crops have a short shelf-life, necessitating a robust Cold-Chain Infrastructure to prevent massive post-harvest losses.
- High Gestation Periods: Perennial crops like sandalwood or agarwood require several years before providing returns, creating a capital gap for small farmers.
- Climate Change: Hilly regions face shifting snowfall patterns, while coastal areas are vulnerable to increasing cyclonic frequency, both of which threaten HVC yields.
- Phytosanitary Standards: To penetrate EU and US markets, Indian produce must meet stringent chemical residue and quality standards.
The Way Ahead: Towards "Viksit Bharat"
To ensure the success of this diversification, the government is focusing on:
- Digital and Geospatial Mapping: Using satellite data to monitor orchard health and predict yields.
- Farmer Producer Organizations (FPOs): Organizing the 10 million small-scale coconut farmers into FPOs to achieve economies of scale.
- Brand Building: Positioning "Indian Sandalwood" and "Indian Cashew" as premium global brands by 2030.
- Mission for Integrated Development of Horticulture (MIDH): Strengthening post-harvest management and modernizing nurseries through institutional support from boards like the Coconut Development Board.
Conclusion
The shift toward high-value crop diversification is a move from subsistence to surplus. By integrating regional agro-climatic strengths with global market demands, India is not just securing its food systems but is also empowering its farmers to become pivotal players in the global value chain. This strategy is essential for achieving the vision of a USD 5 trillion economy and a prosperous, developed India by 2047.
Geopolitical Shocks and India’s Fertilizer Security: The 2026 Crisis
- 21 Apr 2026
In News:
The escalation of the US-Israel vs. Iran conflict in early 2026, culminating in the closure of the Strait of Hormuz in February, has sent shockwaves through global commodity markets. For India, this maritime blockade is not merely a diplomatic hurdle but a direct threat to national food security. The crisis underscores India’s heavy reliance on the Persian Gulf for both finished fertilizers and the energy inputs required for domestic production.
The Anatomy of the Crisis: India’s Vulnerability
India’s agricultural model, rooted in the Green Revolution, remains high-intensity, requiring massive annual consumption of nutrients—approximately 40 million tonnes (mt) of urea alone. The current blockade has exposed two critical vulnerabilities:
The Import Dependency Trap
The Gulf Cooperation Council (GCC) nations (Oman, Qatar, Saudi Arabia, UAE, and Bahrain) are indispensable partners in India’s "Soil to Silo" chain:
- Urea: GCC countries account for nearly 49% of India’s nitrogen fertilizer imports.
- Feedstock (LNG): Over 60% of India's Liquefied Natural Gas (LNG) is sourced from the Gulf. Since natural gas is the primary feedstock for urea, the energy blockade has crippled domestic factories.
- Intermediates: Prices for essential raw materials like Sulphur and Ammonia have tripled, exceeding $900 per tonne.
The Maritime Chokepoint
The Strait of Hormuz is a physical bottleneck. Unlike the 2022 Russia-Ukraine crisis, where fertilizers could be rerouted via rail or alternative ports, the Hormuz closure "traps" cargo. Tanker traffic dropped to near zero by March 2026 as insurance companies withdrew war-risk coverage, making shipping economically unviable.
Impact Assessment:
- The Price Shock: International urea bids skyrocketed from $510 in February to $950 per tonne by April 2026.
- Production Contraction: Domestic urea output fell from a monthly average of 2.5 mt to 1.5 mt in March 2026 due to LNG shortages and force majeure invoked by suppliers like Petronet LNG.
- Subsidy Burden: To insulate farmers, the Union Cabinet cleared a 12% hike in the Nutrient Based Subsidy (NBS) for Kharif 2026, totaling ?41,533 crore. Analysts estimate the total annual subsidy bill could swell by an additional ?25,000 crore, reaching nearly ?2 trillion.
Government Response and Mitigation Strategies
To prevent a "Harvest of Discontent," the Indian government has launched a multi-pronged tactical response:
- Sourcing Diversification: India is aggressively pivoting to non-Gulf suppliers. Agreements have been fast-tracked with Morocco (for Phosphorus), Russia, Canada, and Jordan (for Potash), and Indonesia/Malaysia (for Ammonia).
- The "Priority Sector-2" Mandate: Under the Natural Gas (Supply Regulation) Order, 2026, the government has mandated that 70% of available natural gas be prioritized for urea plants to keep domestic production running.
- Buffer Management: Leveraging a lean consumption phase, India built a massive opening stock of 18 million tonnes (46% of seasonal requirement) before the peak of the crisis, providing a critical safety net for the Kharif 2026 season.
- Promoting Alternatives: To reduce the pressure on Di-Ammonium Phosphate (DAP), the government is encouraging the use of Single Super Phosphate (SSP) and Triple Super Phosphate (TSP).
Challenges and Structural Risks
- Fiscal Stress: The widening gap between soaring international prices and the fixed subsidized price for farmers (e.g., ?266.5 per 45kg bag of urea) places an immense burden on the fiscal deficit.
- The Rabi Risk: While current stocks may sustain the Kharif crop (June–September), the Rabi season (starting October) remains highly vulnerable if diplomatic efforts fail to reopen the Strait.
- Black Market Emergence: Shortages in raw materials often lead to hoarding at the retail level, requiring strict enforcement under the Essential Commodities Act.
The Way Ahead: A "Nutrient-Secure" India
The 2026 crisis is a wake-up call to transition from "Volume-based" to "Efficiency-based" agriculture:
- Nano-Fertilizers: Accelerating the shift to Nano Urea and Nano DAP can reduce the logistics of importing millions of bulk bags.
- Bio-Stimulants & Fortification: Coating fertilizers with micronutrients (Zinc, Boron) and using Phosphate Solubilizing Bacteria can help unlock nutrients already present in the soil, reducing the need for chemical inputs.
- Diplomatic Neutrality: India must leverage its "Strategic Autonomy" to advocate for neutral trade corridors for food and fertilizer precursors within conflict zones.
Conclusion
The Iran war has highlighted the "thermal injustice" of India’s food security—where a conflict thousands of miles away can dictate the margins of a farmer in Punjab or Andhra Pradesh. Long-term resilience lies in reducing the nitrogen-heavy dependency on the Gulf and embracing a circular nutrient economy powered by domestic innovation and biological alternatives.
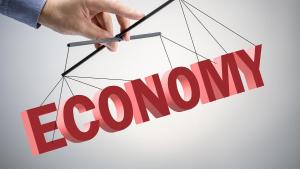
The Global Economic Pecking Order: Analyzing India’s Shift to the 6th Largest Economy
- 20 Apr 2026
In News:
The global economic landscape of 2026 has witnessed a significant recalibration. According to the IMF’s World Economic Outlook 2026, India has slipped to the position of the world’s 6th largest economy. This development marks a notable shift from 2022, when India famously overtook the United Kingdom to claim the 5th spot. While the ranking shift has generated headlines, a deeper analysis reveals that the change is driven more by currency dynamics and statistical adjustments than by a fundamental loss of economic momentum.
Methodology of Global Rankings
To understand India's current position, it is essential to look at how the IMF determines global rankings. These are measured using Nominal GDP expressed in current US dollars. This calculation relies on two variables:
- Domestic GDP in local currency (the Rupee).
- Exchange Rates against the US dollar.
This methodology creates a "valuation effect." An economy might grow robustly in domestic terms, but if its currency depreciates against the dollar, its global standing in dollar terms can diminish. Conversely, if the British Pound or Japanese Yen strengthens, those nations can leapfrog others even with slower real growth.
The 2026 Economic Standings
As per the 2026 estimates, the global economic hierarchy reflects a massive gap between the "Big Two" and the rest of the world. The United States leads with a GDP exceeding $32 trillion, followed by China at approximately $20 trillion.
The subsequent tier is highly congested, with several nations clustered around the $4 trillion mark:
- Japan: $4.38 trillion
- United Kingdom: $4.27 trillion
- India: $4.15 trillion
Because these economies are so closely matched, even minor fluctuations in data or currency can trigger a "musical chairs" effect in the rankings.
Deconstructing India’s Decline: Three Primary Factors
1. Statistical Revisions and Base Year Changes: The decline was partly triggered by a downward revision of India’s GDP estimates. Following the adoption of a new base year, the government revised the 2025-26 GDP from ?357 lakh crore to ?345 lakh crore. This statistical correction indicated that previous estimates had slightly overstated the economy's size, immediately impacting the dollar conversion.
2. Currency Depreciation (The Valuation Effect): The Indian Rupee faced significant depreciation against the US dollar in 2025-26. Simultaneously, the British Pound and the Japanese Yen showed relative resilience or appreciation. This "double whammy" meant that while India’s economy grew in Rupee terms, its "dollar-denominated size" shrank relative to the UK and Japan.
3. Exchange Rate Volatility: The IMF’s reliance on nominal dollar-based comparisons makes these rankings highly sensitive to the global forex market. In a year of global financial tightening, currency movements often overshadow real production gains in the short-term ranking tables.
Strategic Future Outlook
Economists and the IMF suggest that the slip to the 6th position is a temporary statistical "re-basing" rather than a structural decline. India’s long-term fundamentals including a strong demographic dividend, infrastructure spending, and digital transformation remain intact.
- 2027 Projections: India is expected to regain the 4th largest economy spot as the effects of currency volatility stabilize.
- 2031 Projections: India is on a trajectory to become the 3rd largest economy, likely overtaking Germany, provided it maintains a consistent growth rate and manages inflationary pressures.
The Rise of the Woman Farmer: Towards Gender-Inclusive Agri-Food Systems
- 25 Mar 2026
In News:
The United Nations has officially designated 2026 as the International Year of the Woman Farmer (IYWF). This global recognition highlights the indispensable role women play in maintaining global food security and rural resilience. In India, where agriculture is the backbone of the economy, women are the primary drivers of the sector. Despite being historically categorized as "invisible laborers," a paradigm shift is underway to recognize them as independent entrepreneurs and technological leaders.
To mark this transition, India recently hosted the Global Conference on Women in Agri-Food Systems (GCWAS–2026) in New Delhi, focusing on gender-responsive policies and the economic inclusion of women in the $5 trillion economy vision.
The Indian Context: Statistical Overview
The "feminization of agriculture" in India is reflected in the sheer scale of female participation in the rural workforce:
- Livelihood Dominance: Approximately 80% of all economically active women in rural India are employed in the agricultural sector.
- Workforce Dynamics: Of the rural female workforce, 33% serve as agricultural laborers and 48% are self-employed farmers.
- Financial Inclusion: Since its inception, the PM-KISAN scheme has disbursed over ?1.01 lakh crore to women, who constitute roughly 25% of the total beneficiaries.
- Collectivization: The movement toward formal business structures is gaining momentum, with 1,175 Farmer Producer Organizations (FPOs) currently boasting 100% women shareholders.
Multi-Dimensional Roles and Contributions
Women are involved across the entire agricultural value chain, performing roles that range from traditional labor to high-tech service provision.
1. Crop Production and Livestock Management: Women handle the most labor-intensive pre-harvest tasks, such as sowing, weeding, and paddy transplantation. In the allied sectors, they are the primary managers of dairy, poultry, and small ruminants. The success of the Pashu Sakhi model where women provide doorstep veterinary services has been instrumental in reducing livestock mortality and increasing household income.
2. Post-Harvest Value Addition: Through Self-Help Groups (SHGs), women lead the transformation of raw produce into marketable goods. Activities like spice grinding, mushroom cultivation, and honey processing under the National Beekeeping and Honey Mission (NBHM) have significantly increased the shelf life and profitability of farm output.
3. Technological Adoption: The Namo Drone Didi Scheme is a flagship initiative providing 15,000 drones to women SHGs. This empowers them to provide high-tech services like precision liquid fertilizer and pesticide application, moving them away from manual drudgery toward skilled, service-based livelihoods.
Major Government Initiatives and Institutional Support
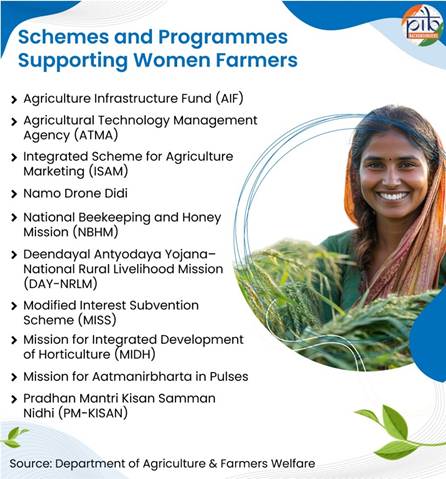
A robust framework of schemes and institutions supports the economic and social empowerment of women farmers:
- Mahila Kisan Sashaktikaran Pariyojana (MKSP): A sub-component of DAY-NRLM, it has supported over 4.62 crore Mahila Kisans in adopting agro-ecological practices and sustainable livestock management.
- Agriculture Infrastructure Fund (AIF): Provides debt financing with a 3% interest subvention for women-led projects to develop post-harvest facilities like cold storage and warehouses.
- Krishi Sakhi Programme: A dedicated cadre of 70,000 women para-extension workers is being trained to provide doorstep guidance on natural farming and soil health, bridging the "lab-to-land" gap.
- ICAR-Central Institute for Women in Agriculture (CIWA): Located in Bhubaneswar, this institute conducts specialized research to develop drudgery-reducing tools (like pedal-operated coconut dehuskers and maize shellers) tailored for female ergonomics.
- Modified Interest Subvention Scheme (MISS): Ensures affordable credit through Kisan Credit Cards (KCC), with the collateral-free limit increased to ?2 lakh as of 2025 to assist women who lack land titles.
Critical Challenges and Barriers
Despite their significant contributions, women farmers face systemic hurdles that hinder their full potential:
- Land Ownership and Invisibility: A majority of women do not hold formal land titles. This lack of "legal recognition" makes it difficult for them to register for government portals like PM-KISAN or access institutional bank loans that require collateral.
- Technological Mismatch: Most agricultural machinery is traditionally designed for men. The high physical drudgery associated with traditional tools continues to cause significant musculoskeletal strain.
- Knowledge and Information Gap: Agricultural extension services have traditionally targeted male heads of households. Technical training on high-yield variety (HYV) seeds or modern pesticides often fails to reach the women who are the actual implementers in the fields.
- Climate Vulnerability: Women have fewer resources to adapt to sudden climate shocks. During periods of drought, the added burden of walking longer distances for water and fodder leaves them with less time for productive farm management.
The Roadmap for IYWF 2026 and Beyond
To move from subsistence to sustainability, the following strategic interventions are necessary:
- Digital Verification of Land: Speeding up the digital linking of land records to ensure more women can self-register for Direct Benefit Transfer (DBT) schemes.
- Scaling Women-Led FPOs: Reaching the target of 10,000 FPOs with a focus on states like Odisha, Bihar, and Jharkhand, where women-led collectives are already thriving.
- Gender-Sensitive Mechanization: Expanding the scope of Farm Machinery Training and Testing Institutes (FMTTIs) to specifically train women in operating and repairing small-scale, ergonomic machinery.
- Mainstreaming Krishi Sakhis: Institutionalizing these para-professionals as the formal link between the government’s technical departments and the rural farming community.
Conclusion
The empowerment of women farmers is not just a matter of social equity but a prerequisite for India’s food security and the achievement of a $5 trillion economy. By transforming women from laborers to entrepreneurs through schemes like Namo Drone Didi and the Dalhan Aatmanirbharta Mission, India can lead the global narrative during the International Year of the Woman Farmer 2026. Strengthening women’s leadership in agriculture will ultimately create a more resilient, inclusive, and climate-smart agri-food system for the future.
EV Battery Fires in India
- 23 Mar 2026
In News:
A recent fire incident in Indore, suspected to have originated from an electric vehicle (EV) charging point, has brought renewed attention to the issue of EV battery safety in India. The tragedy highlights the need to understand the risks associated with lithium-ion batteries and strengthen preventive measures.
Understanding EV Battery Technology
Most electric vehicles rely on lithium-ion batteries, which are widely used due to their high energy density and efficiency. These batteries are generally safe and are equipped with a Battery Management System (BMS) that regulates temperature, monitors performance, and ensures safe charging and discharging cycles.
However, under certain abnormal conditions, these systems may fail, leading to safety hazards.
Thermal Runaway: The Core Risk
The primary cause of EV battery fires is a phenomenon known as thermal runaway. It begins when a battery cell overheats, triggering a chain reaction that spreads to adjacent cells.
This process leads to rapid temperature escalation, release of flammable gases, and potential ignition. The presence of toxic gases such as hydrogen fluoride further increases the severity of such incidents.
Key Causes of EV Battery Fires
Several factors can trigger thermal runaway and subsequent fire incidents. Physical damage to the battery pack, especially due to accidents or impacts, may cause internal short circuits.
Overcharging or the use of faulty and non-certified chargers can lead to excessive heat buildup. Manufacturing defects, though rare, can also create internal electrical faults.
Additionally, inadequate electrical infrastructure—such as weak wiring or overuse of extension cords—can contribute to overheating during charging.
Role of Environmental and Operational Factors
External conditions play a crucial role in battery safety. High ambient temperatures, common in India, increase thermal stress on batteries, particularly when vehicles are parked in direct sunlight or charged immediately after prolonged use.
Ageing batteries may degrade internally, raising the likelihood of malfunction. Flooding is another critical risk factor, as water ingress can cause delayed short circuits and fires.
Moreover, surrounding conditions such as nearby combustible materials or power failures can aggravate fire hazards.
EV Fires vs Conventional Vehicle Fires
While EV fires attract significant attention, conventional petrol and diesel vehicles are statistically more prone to fires. However, EV battery fires differ in nature—they tend to burn hotter, spread faster, and are more difficult to extinguish, often requiring specialised firefighting techniques and large volumes of water.
Safety Measures and Technological Advancements
The EV industry is actively adopting measures to enhance safety. Advanced cooling systems using liquid or evaporative techniques are being developed to manage temperature spikes.
Innovations such as solid-state batteries and improved cell design aim to reduce the risk of fire propagation.
At the user level, safety depends on practices such as using manufacturer-approved chargers, avoiding unsafe charging conditions, ensuring proper electrical infrastructure, and conducting periodic battery inspections.
Regulatory Framework in India
India has strengthened safety norms through the Bureau of Indian Standards (BIS) and automotive standards such as AIS-156.
These standards mandate rigorous testing, including thermal propagation tests, and require batteries to provide sufficient time for passenger evacuation in case of fire. Such regulations aim to enhance reliability and consumer confidence in EV technology.
Conclusion
EV battery fires, though relatively rare, pose serious risks due to their intensity and complexity. The Indore incident underscores the need for a comprehensive approach combining technological innovation, regulatory oversight, and user awareness.
As India accelerates its transition towards electric mobility, ensuring robust safety standards and responsible usage will be critical for sustainable and secure adoption of EVs.
India’s Carbon Credit Plan: CCUS vs Carbon Farming Debate
- 18 Mar 2026
In News:
The Union Budget 2026 announcement of a ?20,000 crore carbon credit programme based on the Department of Science and Technology (DST) roadmap has triggered a debate over its scope and intent. The confusion stems from the overlapping use of the term carbon credits, blurring the distinction between industrial decarbonisation through Carbon Capture, Utilisation and Storage (CCUS) and agriculture-based carbon farming initiatives.
Understanding CCUS and Carbon Farming
CCUS: Industrial Decarbonisation Tool
Carbon Capture, Utilisation and Storage (CCUS) is a technology-driven approach aimed at reducing emissions from hard-to-abate sectors such as:
- Power and refineries
- Steel and cement
- Chemicals
It involves capturing carbon dioxide from concentrated emission sources, followed by its utilisation in industrial processes or permanent storage underground. CCUS is particularly relevant for sectors that cannot fully transition to renewable energy.
Carbon Farming: Nature-Based Solution
Carbon farming refers to agricultural practices that enhance carbon sequestration in soil and biomass, thereby removing carbon dioxide from the atmosphere. It includes:
- Agroforestry
- Biochar application
- Conservation agriculture
Unlike CCUS, carbon farming is part of Carbon Dioxide Removal (CDR) strategies and is linked to voluntary carbon markets, offering potential income streams for farmers.
Why Agriculture is Not Part of CCUS
The DST roadmap clearly excludes agriculture from CCUS due to fundamental differences:
- Diffuse Emissions: Agricultural emissions are spread across large areas, unlike concentrated industrial sources
- Biological Nature: Emissions such as methane and nitrous oxide are biologically generated and cannot be mechanically captured
- Technological Mismatch: CCUS captures CO? from flue gases, whereas agriculture focuses on absorbing atmospheric carbon
- Strategic Distinction: CCUS prevents new emissions, while carbon farming removes existing carbon
Key Opportunities
1. Industrial Decarbonisation: CCUS offers a crucial pathway to reduce emissions from sectors contributing significantly to India’s carbon footprint. The ?20,000 crore investment aims to scale up industrial carbon capture and storage infrastructure.
2. New Income Streams for Farmers: A robust carbon farming framework could enable farmers to earn through carbon credits by adopting sustainable practices, integrating climate action with rural development.
3. Soil Carbon Sequestration: India’s vast agricultural land holds immense potential to act as a carbon sink, improving soil fertility and long-term productivity.
4. Growth of Carbon Markets: There is increasing demand for nature-based carbon credits, with private sector initiatives already piloting farmer-linked carbon credit models.
5. Climate-Resilient Agriculture: Carbon-friendly practices align with broader goals of sustainable and climate-resilient farming systems.
Challenges and Concerns
1. Policy and Communication Gaps: The use of the term carbon credit in the Budget has created confusion between industrial and agricultural pathways, leading to misplaced expectations.
2. High Cost of CCUS: CCUS is capital-intensive and technology-heavy, requiring sustained investment and infrastructure development.
3. Monitoring and Verification Issues: Measuring soil carbon and agricultural emissions is complex, requiring robust verification mechanisms to ensure credibility in carbon markets.
4. Policy Conflation: Lack of clear distinction between emission reduction (CCUS) and carbon removal (carbon farming) has hindered policy clarity.
5. Stakeholder Expectations: Farmers may expect direct financial benefits from the announced programme, whereas the current allocation is primarily targeted at industry.
Way Forward
- Clear Policy Demarcation: Separate industrial CCUS initiatives from agricultural carbon farming policies
- Dedicated Framework for Carbon Farming: Develop targeted funding, institutions, and verification systems for agriculture-based carbon credits
- Strengthen Communication: Use precise terminology to avoid confusion between mitigation approaches
- Scale Industrial CCUS Deployment: Ensure effective implementation in hard-to-abate sectors
- Integrated Climate Strategy: Promote both industrial and nature-based solutions for a balanced pathway to net-zero
Conclusion
India’s carbon credit strategy stands at a critical juncture, balancing technology-driven industrial decarbonisation with the emerging promise of nature-based carbon farming. While the ?20,000 crore allocation is clearly aimed at CCUS, the growing interest in agricultural carbon markets highlights the need for a parallel, well-defined policy framework. A coherent and differentiated approach will be essential to achieving India’s climate goals while ensuring economic and social benefits.
Melting Himalayan Glaciers and Emerging Cryospheric Hazards

- 17 Mar 2026
In News:
A recent ISRO study published in NPJ Natural Hazards has highlighted that the August 2025 Dharali flash flood in Uttarakhand was triggered by the collapse of an exposed ice patch on the Srikanta Glacier. This finding marks a significant shift in the understanding of Himalayan disasters, as it moves attention away from large glacial lake outburst floods (GLOFs) toward smaller, often overlooked cryospheric instabilities caused by rapid deglaciation.
Understanding Glacier Melting (Deglaciation)
Glacier melting, or deglaciation, refers to the reduction in a glacier’s mass and volume when ice loss through melting and sublimation exceeds the accumulation of snowfall. With rising temperatures, the protective snow and firn layers thin out, exposing older and structurally weak ice. These exposed ice patches become highly unstable and can collapse, triggering flash floods even in the absence of large glacial lakes.
Insights from the Dharali Flash Flood
The Dharali disaster demonstrated that small-scale geomorphic processes can have large-scale impacts. The flood was caused by the collapse of an ice patch located within a nivation hollow on a steep slope of the Srikanta Glacier. This challenges the conventional focus on GLOFs as the primary source of glacial hazards and underscores the importance of monitoring micro-level changes in glacial landscapes.
Data and Trends on Glacier Melting
Recent data indicate that Himalayan glaciers have been losing ice at an average rate of nearly 0.5 metres of vertical height annually since 2000. The Hindu Kush Himalaya region is warming faster than the global average, with projections suggesting that up to 75% of glacier volume could be lost by 2100. This has serious implications for water security, as over 1.3 billion people depend on rivers originating from these glaciers. While initial melting may increase river flows, it eventually leads to long-term water scarcity. Additionally, the frequency of glacial hazards such as GLOFs and similar events has tripled over the past two decades.
Factors Contributing to Glacier Instability
The increasing instability of glaciers can be attributed to multiple interrelated factors. Rising atmospheric temperatures reduce snow cover and expose darker ice, which absorbs more heat and accelerates melting, as observed in the Srikanta Glacier. Black carbon deposition from biomass burning and vehicular emissions further intensifies melting by lowering the albedo of glaciers, with significant impacts seen near the Gangotri Glacier. Changes in precipitation patterns, particularly the shift from snowfall to rainfall at high altitudes, hinder glacier recharge, as seen in Ladakh. Infrastructure development, including road construction and tunnelling in fragile mountain ecosystems, creates localized disturbances and increases slope instability. Moreover, geomorphic processes like nivation-characterized by repeated freezing and thawing, gradually weaken slopes and create hollows that can collapse suddenly, as in the Dharali event.
Government Initiatives and Scientific Efforts
India has undertaken several initiatives to monitor and mitigate glacier-related risks. The National Mission for Sustaining the Himalayan Ecosystem (NMSHE) focuses on understanding glacier dynamics and ecosystem resilience. ISRO has been actively using satellite technologies such as Cartosat and RISAT to map over 9,500 glaciers and assess potential risks. Early Warning Systems have been installed in vulnerable regions like the Rishiganga and Dhauliganga valleys following past disasters. Additionally, international collaborations, such as Indo-Swiss programmes, are enhancing research capabilities and climate resilience strategies in the Himalayan region.
Challenges in Glacier Monitoring and Management
Despite these efforts, several challenges persist. The rugged and inaccessible terrain of the Himalayas makes it difficult to install and maintain monitoring infrastructure. There is also a lack of long-term historical data, which limits the ability to predict rare events such as ice-patch collapses. Transboundary issues further complicate glacier management, as many glaciers span across India, China, and Pakistan, restricting coordinated research and data sharing. Socio-economic vulnerabilities are high, as communities often reside in narrow valleys prone to sudden flooding. Additionally, unpredictable micro-climatic conditions make it difficult to anticipate disasters, as seen in past events like the Chamoli avalanche.
Way Forward
Addressing these emerging risks requires a multi-pronged approach. Integrated monitoring systems that combine satellite observations with ground-based sensors should be developed to track both large and small-scale glacial changes. Disaster frameworks must expand beyond GLOFs to include hazards like ice-patch collapses and nivation processes. Community participation is crucial, and local populations should be trained to recognize early warning signs such as exposed ice surfaces. Infrastructure development in Himalayan regions must be made climate-resilient, with strict environmental impact assessments. Regional cooperation among Himalayan countries is essential for effective data sharing and coordinated response. Furthermore, systematic mapping of vulnerable slopes and nivation zones can help in identifying high-risk areas.
Conclusion
The Dharali flash flood highlights the evolving nature of Himalayan hazards in the context of climate change. As glaciers continue to recede, new forms of instability are emerging, necessitating a shift from traditional monitoring approaches to more comprehensive, ridge-to-valley surveillance systems. Protecting the fragile Himalayan ecosystem is not only an environmental priority but also critical for ensuring the safety, livelihoods, and water security of millions of people dependent on these mountains.
Fiscal Federalism in India and the Debate over the 41% Tax Devolution
- 12 Mar 2026
In News:
The debate on fiscal federalism in India has intensified following the Union government’s acceptance of the 41% tax devolution recommended by the Sixteenth Finance Commission. While the recommendation appears to maintain the existing share of tax revenues for States, critics argue that structural changes in the fiscal framework may gradually reshape the balance of financial power between the Centre and the States.
Fiscal Federalism in India
Fiscal federalism refers to the division of financial powers, taxation authority, and expenditure responsibilities between different levels of government in a federal system. In India, the Constitution establishes a structured framework for fiscal relations between the Union and the States.
Key constitutional provisions include:
- Articles 268–281: These articles govern the distribution of taxation powers and revenue sharing between the Union and the States.
- Article 280: Provides for the establishment of the Finance Commission, which recommends the sharing of central taxes and grants to States.
- Seventh Schedule: Divides taxation powers between the Union List and the State List.
Since the Union government collects a major share of taxes, the Finance Commission periodically recommends how the divisible pool of central taxes should be distributed among States.
Evolution of Tax Devolution
The share of States in the divisible pool has increased over time:
- 14th Finance Commission: Increased States’ share to 42%.
- 15th Finance Commission: Reduced it slightly to 41% after the reorganisation of Jammu and Kashmir.
- 16th Finance Commission: Recommended retaining the 41% share.
Although the percentage has remained unchanged, analysts argue that the effective transfer of resources to States may be declining.
The Divisible Pool and the Issue of Cesses and Surcharges
The divisible pool represents the portion of central tax revenues that is shared with States. However, certain revenues such as cesses and surcharges are excluded from this pool and are retained entirely by the Union government.
Over time, the share of the divisible pool in gross tax revenue has declined:
- 13th Finance Commission period: 89.2%
- 14th Finance Commission period: 82.1%
- 15th Finance Commission period: 78.3%
This trend implies that even though the States’ share is fixed at 41%, the base from which this percentage is calculated has shrunk, reducing the overall transfer to States.
Key Recommendations of the Sixteenth Finance Commission
The Union government accepted several major recommendations of the Commission, including:
- Retaining 41% tax devolution to States
- Acceptance of the horizontal distribution formula among States
- Approval of grants to local bodies
- Continuation of the disaster management funding framework
However, several structural reforms proposed by the Commission were deferred. These include:
- Reform of Fiscal Responsibility Legislation (FRL) frameworks
- Regulation of off-budget borrowings by States
- Reforms in the power sector distribution companies (DISCOMs)
- Rationalisation of subsidies
Fiscal Stress in States
The Commission also highlighted rising fiscal stress in several States. For example:
- Punjab: Debt–GSDP ratio of 42.9% and revenue deficit of 3.7% of GSDP (2023–24).
- Rajasthan: Liabilities at 37.9% of GSDP.
- West Bengal: Liabilities at 38.3% of GSDP.
- Andhra Pradesh: Liabilities around 34.6% of GSDP.
In some cases, borrowing is used primarily to finance revenue expenditure such as salaries and interest payments, rather than capital investment. Another concern is off-budget borrowing, where loans are raised through government-controlled entities and serviced using public funds.
Changes in Horizontal Devolution
The Finance Commission also revised the horizontal distribution formula among States. Earlier, a criterion known as tax and fiscal effort rewarded States that improved their tax collection efficiency. This has now been replaced with a “contribution to GDP” indicator with a weight of 10%.
This shift may benefit economically stronger States such as Maharashtra, Gujarat, and Karnataka, which contribute significantly to national GDP. However, poorer States such as Bihar, Jharkhand, and Uttar Pradesh, which depend heavily on central transfers, may gain relatively less, raising concerns about weakening the principle of fiscal equalisation.
Local Body Grants
The Sixteenth Finance Commission also recommended ?7,91,493 crore in grants for rural and urban local bodies. These grants are divided into:
- Basic grants for essential services and administration.
- Performance grants linked to conditions such as timely constitution of State Finance Commissions, audited accounts, and compliance with data reporting systems.
However, implementation challenges persist, as only 62.6% of recommended urban local body grants were released during the previous Finance Commission period.
Conclusion
The retention of 41% tax devolution appears to preserve the formal structure of fiscal federalism. However, the increasing use of cesses and surcharges, changes in allocation criteria, and delays in structural reforms indicate evolving Centre–State fiscal dynamics. These developments may gradually reshape India’s fiscal federal landscape, raising important questions about resource distribution, fiscal autonomy, and cooperative federalism.
State of the World’s Migratory Species Report

- 07 Mar 2026
In News:
Migratory species are vital components of global biodiversity and play an important role in maintaining ecological balance across ecosystems. However, recent assessments indicate that many migratory species are facing growing threats due to human activities and environmental changes. The latest interim update to the State of the World’s Migratory Species Report warns that nearly half of the world’s migratory species populations are declining, highlighting the urgent need for stronger international conservation efforts.
About the State of the World’s Migratory Species Report
The State of the World’s Migratory Species Report is a global scientific assessment that evaluates the conservation status, population trends, and threats facing migratory animals worldwide. The report is prepared under the Convention on the Conservation of Migratory Species of Wild Animals (CMS), an international treaty established in 1979 under the United Nations Environment Programme (UNEP). CMS provides a framework for international cooperation to conserve migratory wildlife and their habitats across national boundaries.
The first comprehensive global report was released in 2024, covering 1,189 species listed under CMS and analysing trends among more than 3,000 additional migratory species worldwide. The assessment relies on scientific data from sources such as the International Union for Conservation of Nature (IUCN) Red List, population monitoring studies, and peer-reviewed scientific literature.
Importance of Migratory Species
Migratory species contribute significantly to ecosystem functioning and human livelihoods. Migratory birds help in pollination, seed dispersal, and pest control, while marine animals such as whales and fish support marine food chains and nutrient cycling. Large migratory mammals distribute nutrients across landscapes and influence vegetation patterns.
These species also hold economic and cultural importance, supporting tourism, food systems, and traditional practices in many regions. However, migration makes species highly vulnerable, as the loss of even a single habitat along their migration route can disrupt entire ecological networks. Effective conservation therefore requires coordinated action across multiple countries and ecosystems.
Major Findings of the Latest Report
1. Declining Populations of Migratory Species
The report highlights worrying global trends in migratory wildlife populations. Approximately 49% of migratory species protected under CMS are experiencing population declines, while about 24% face a risk of extinction. Compared to earlier assessments, the proportion of declining species has increased by around five percentage points within two years, indicating an accelerating conservation crisis. Out of the 1,189 CMS-listed species, about 582 species show declining population trends.
2. Rising Extinction Risks
The assessment also notes that 26 migratory species have moved to higher extinction-risk categories on the IUCN Red List. Among them, 18 species are migratory shorebirds, highlighting severe threats to coastal and wetland ecosystems. Species affected include birds such as cranes and pelicans, ungulates such as wildebeest, freshwater fish species, and marine animals including sharks, rays, and sea turtles.
3. Habitat Loss and Overexploitation
The report identifies habitat loss and overexploitation as the most significant threats to migratory species. Activities such as urban expansion, agricultural development, infrastructure construction, overfishing, and hunting have disrupted migratory routes and degraded critical habitats.
Large infrastructure projects such as roads, railways, pipelines, and fences are increasingly blocking migration corridors, particularly for large terrestrial mammals in regions such as Central Asia. Since migratory species depend on multiple habitats across countries, the destruction of even one site along their migration pathway can jeopardise their survival.
4. Emerging Threat of Avian Influenza
Another emerging threat highlighted in the report is Highly Pathogenic Avian Influenza (H5N1). Disease outbreaks have caused large-scale mortality events among several migratory bird populations and have even affected marine mammals. Species impacted include African Penguins, Humboldt Penguins, Peruvian Pelicans, and Red-crowned Cranes. Marine mammals such as the South American Sea Lion and South American Fur Seal have also been affected, indicating the growing ecological impacts of disease outbreaks.
Conservation Progress and Key Biodiversity Areas
Despite these concerning trends, the report identifies several conservation successes. Seven migratory species listed under CMS have shown improvements in conservation status, including the Saiga Antelope, Scimitar-horned Oryx, and the Mediterranean Monk Seal. These cases demonstrate that coordinated international conservation measures can effectively restore threatened species populations.
The report also highlights the significance of 9,372 Key Biodiversity Areas (KBAs) that serve as critical habitats for migratory species. However, 47% of these areas currently lack formal protection, making them vulnerable to human pressures and habitat degradation.
Conclusion
The State of the World’s Migratory Species Report underscores the growing conservation crisis facing migratory wildlife. Declining populations, rising extinction risks, habitat loss, overexploitation, and emerging diseases collectively threaten the survival of many species. Addressing these challenges requires strengthened international cooperation, protection of migratory corridors and key biodiversity areas, and sustainable management of ecosystems. Ensuring the conservation of migratory species is essential not only for preserving biodiversity but also for maintaining ecological balance and supporting human livelihoods across the globe.
India’s New GDP Series (Base Year 2022–23): A Major Statistical Reform

- 27 Feb 2026
In News:
The Ministry of Statistics and Programme Implementation (MoSPI) is releasing a new series of National Accounts Statistics (NAS) with 2022–23 as the base year, replacing the 2011–12 base year. The revised series aims to improve the accuracy and granularity of estimates of Gross Domestic Product (GDP) and Gross Value Added (GVA), reflecting structural changes in the Indian economy over the past decade.
Rationale for Revision
Since the previous base year revision in 2015, India’s economy has undergone significant transformations:
- Expansion of the digital economy and e-commerce
- Increased formalisation following the GST regime
- Shifts in consumption, employment, and production patterns
- Rapid growth of financial and service sectors
Updating the base year ensures better measurement of real growth, improved sectoral representation, and stronger evidence-based policymaking.
Key Structural Improvements
1. Sectoral Measurement Reforms
- Private Corporate Sector: Earlier, a company’s entire GVA was attributed to its dominant sector. The new approach allocates GVA based on activity-wise revenue shares, improving sectoral accuracy.
- General Government Sector: Inclusion of housing services provided to government employees and better coverage of local bodies and autonomous institutions enhances government output estimation.
2. Better Estimation of the Household Sector
The household sector—one of India’s largest contributors to GVA—will now be estimated using annual data from:
- Annual Survey of Unincorporated Sector Enterprises (ASUSE)
- Periodic Labour Force Survey (PLFS)
This replaces earlier extrapolation methods with direct annual estimation.
3. Improved Consumption Estimates
Private Final Consumption Expenditure (PFCE) will be derived from:
- Household Consumer Expenditure Surveys
- Production-side data
- Administrative datasets
This strengthens measurement of domestic demand.
Integration of Administrative Data
- Expanded use of GST data for regional output estimation and corporate value addition.
- Identification of active companies through tax records.
- Use of RBI’s Statistical Tables Relating to Banks in India (STRBI) for banking sector estimates.
- Replacement of proxy methods for private NBFCs with actual financial data from the Ministry of Corporate Affairs.
These changes improve financial sector GVA estimation and reduce reliance on assumptions.
Informal Sector and Agriculture
Greater use of ASUSE improves coverage of informal enterprises, insurance agents, and Gross Fixed Capital Formation (GFCF) in the unincorporated sector.
Agriculture estimation is strengthened using updated methodologies and data from institutions such as:
- Central Marine Fisheries Research Institute
- Central Inland Fisheries Research Institute
- Grassland and Fodder research bodies
This improves measurement of livestock, fisheries, and fodder output.
Methodological Upgrade: Double Deflation
One of the most significant reforms is the shift from a single deflator to a double deflator method.
- Earlier: Same inflation rate applied to inputs and outputs, causing growth distortions.
- Now: Separate deflators for inputs and outputs, ensuring more accurate real GVA estimates.
This reduces statistical discrepancies and improves credibility.
Additionally, Supply and Use Tables (SUTs) will be integrated, improving consistency between production and expenditure approaches.
International Alignment
India currently follows the System of National Accounts (SNA 2008). With the UN adopting SNA 2025, India plans to align with updated global standards in future revisions.
Challenges
- Complexity of double deflation and data integration.
- Back-series reconstruction may take nearly a year.
- State-level data quality variations.
- Need for greater transparency to avoid credibility debates seen in past revisions.
Conclusion
The 2022–23 base year revision represents one of India’s most comprehensive statistical overhauls in over a decade. By integrating richer datasets, modern methodologies, and improved sectoral coverage, the new GDP series aims to enhance policy reliability and international comparability. Its success, however, will depend on transparent implementation, timely back-series release, and sustained strengthening of India’s statistical ecosystem.
Great Nicobar Project

- 22 Feb 2026
In News:
The National Green Tribunal (NGT) has approved the ?81,000-crore Great Nicobar mega infrastructure project, citing its strategic importance and environmental safeguards. The project covers 166 sq km of Great Nicobar Island (910 sq km), home to Indira Point, India’s southernmost location. It involves diversion of ~130 sq km of forest land and felling of over one million trees, raising significant ecological concerns.
Core Components
The project, initially conceptualised by NITI Aayog and implemented by ANIIDCO, rests on four pillars:
- Integrated Township (≈149 sq km) – Residential, commercial, tourism, logistics and defence infrastructure.
- Transshipment Port at Galathea Bay – Strategically located near the Malacca Strait; projected capacity of 14.2 million TEUs annually.
- Dual-use International Airport (8.45 sq km total allocation) – Second air facility after INS Baaz; requires 4.2 sq km land acquisition, affecting 379 families.
- 450-MVA Gas and Solar Power Plant (0.39 sq km) – To ensure reliable energy supply.
Land reclamation includes 2.98 sq km (port) and 1.94 sq km (airport), requiring 33.35 million cubic metres of construction material.
Strategic Importance
Great Nicobar lies close to the Malacca Strait, through which ~94,000 ships pass annually, accounting for ~30% of global trade and ~one-third of global maritime oil trade. The port aims to compete with Colombo, Hambantota, Port Klang and Singapore, reducing India’s dependence on foreign transshipment hubs.
The island hosts the Andaman and Nicobar Command (since 2001), India’s only tri-services command—and INS Baaz Naval Air Station at Campbell Bay. Defence infrastructure is included in the first construction phase, strengthening India’s Indo-Pacific posture.
Environmental and Social Concerns
Great Nicobar is part of the Sundaland biodiversity hotspot and largely falls under the Great Nicobar Biosphere Reserve. The project led to denotification of Galathea Bay Wildlife Sanctuary and a megapode sanctuary. The endemic Nicobar megapode faces habitat loss, while Galathea Bay is a key nesting site for leatherback turtles.
Indigenous communities are also affected:
- Shompen tribe (~250 people) – Semi-nomadic and highly vulnerable to external exposure.
- Nicobarese community – Many displaced during the 2004 tsunami; resettlement concerns persist.
The island’s population is projected to increase from ~8,500 (2011 Census) to 6.5 lakh by 2050, raising concerns of ecological strain and demographic transformation.
Conclusion
The Great Nicobar Project represents a high-stakes strategic initiative combining maritime trade ambition, defence expansion and geopolitical positioning. However, its implementation in a fragile ecological zone necessitates strict environmental safeguards, transparent governance and protection of tribal rights to ensure sustainable and inclusive development.
India’s Aviation Sector: The Case for Data-Driven Oversight

- 20 Feb 2026
In News:
India’s aviation sector has emerged as one of the fastest-growing in the world, marked by rising passenger traffic, expansion of low-cost carriers, and rapid airport infrastructure development across metros and tier-2 cities. However, regulatory mechanisms have not kept pace with this expansion.
The growing complexity of algorithm-based pricing and market concentration makes a strong case for data-driven oversight, moving beyond reactive crisis management to proactive, evidence-based regulation.
Structural Transformation of India’s Aviation
- Rapid rise in domestic air travel.
- Dominance of low-cost carriers.
- Expansion of airport infrastructure under public-private partnerships.
- Increasing use of dynamic revenue management systems for pricing.
While operational data on passenger numbers, fleet size, and freight movement is regularly tracked, systematic monitoring of fare behaviour and market conduct remains limited.
Why Data-Driven Oversight is Needed
1. Dynamic Pricing and Algorithmic Markets
Airline fares fluctuate in real time based on:
- Demand patterns
- Seat inventory
- Competitor pricing
- Seasonal variation
- Route-level market share
This makes it difficult to distinguish between legitimate demand-driven price increases and potential market power abuse.
2. Limits of Crisis-Based Regulation
Recent fare spikes in India have triggered:
- Temporary fare caps
- Requests for data submission
- Post-facto investigations
However, ad hoc interventions are reactive and do not substitute for continuous, structured oversight. Often, data collected is retrospective and insufficient for robust analysis.
3. Volume-Focused Oversight
Current regulatory practice largely tracks traffic volumes rather than pricing behaviour. In a market increasingly driven by algorithmic decision-making, this creates regulatory blind spots.
Importance of Data Transparency
(a) Identifying Route-Level Market Power
If routes dominated by a single airline consistently show higher fares compared to competitive routes, it may signal structural pricing power.
(b) Tracking Entry and Exit Effects
- Entry of a new airline → Fares usually decline.
- Exit of a competitor → Fares often increase.
Systematic data collection enables regulators to measure competitive intensity.
(c) Monitoring Peak-Period Pricing
Holiday seasons provide natural tests of pricing conduct. Disproportionate fare increases on routes with high market share may indicate dominance leverage.
(d) Algorithmic Accountability
When pricing outcomes are observable and periodically reviewed, airlines are incentivised to embed compliance safeguards within revenue management systems. Transparency acts as a deterrent without constant state intervention.
Global Best Practice: The U.S. DB1B Model
The United States’ Airline Origin and Destination Survey (DB1B), maintained by the Bureau of Transportation Statistics (BTS), provides a model for structured transparency.
- Collects ticket-level data since 1995.
- Covers a 10% random sample of domestic tickets each quarter.
- Tracks fares, routes, and carrier details.
The DB1B database enables:
- Long-term pricing trend analysis
- Competition assessment
- Empirical research
- Transparent policymaking
Adopting a similar 10% sampling framework in India could expand the role of the Directorate General of Civil Aviation (DGCA) from volume tracking to behaviour monitoring.
Addressing Industry Concerns
- Proprietary Algorithms: A sampling framework monitors outcomes, not algorithmic code.
- Technical Burden: Airlines already maintain digital databases; quarterly reporting is feasible.
- Risk of Implicit Coordination: Delayed and aggregated release of data can prevent real-time collusion risks.
Way Forward
- Institutionalise periodic, structured fare data collection.
- Build analytical capacity within regulatory bodies.
- Shift from temporary fare caps to continuous oversight.
- Promote competition while safeguarding consumer interests.
- Strengthen inter-agency coordination between aviation and competition authorities.
Conclusion
India’s aviation growth is a major economic achievement. However, rapid expansion without robust data infrastructure risks regulatory vulnerabilities. The solution lies not in heavy-handed control but in structured transparency and analytical regulation.
In an increasingly algorithm-driven aviation market, regulatory institutions must evolve toward data-centric governance to ensure fair competition, consumer protection, and sustainable sectoral growth.
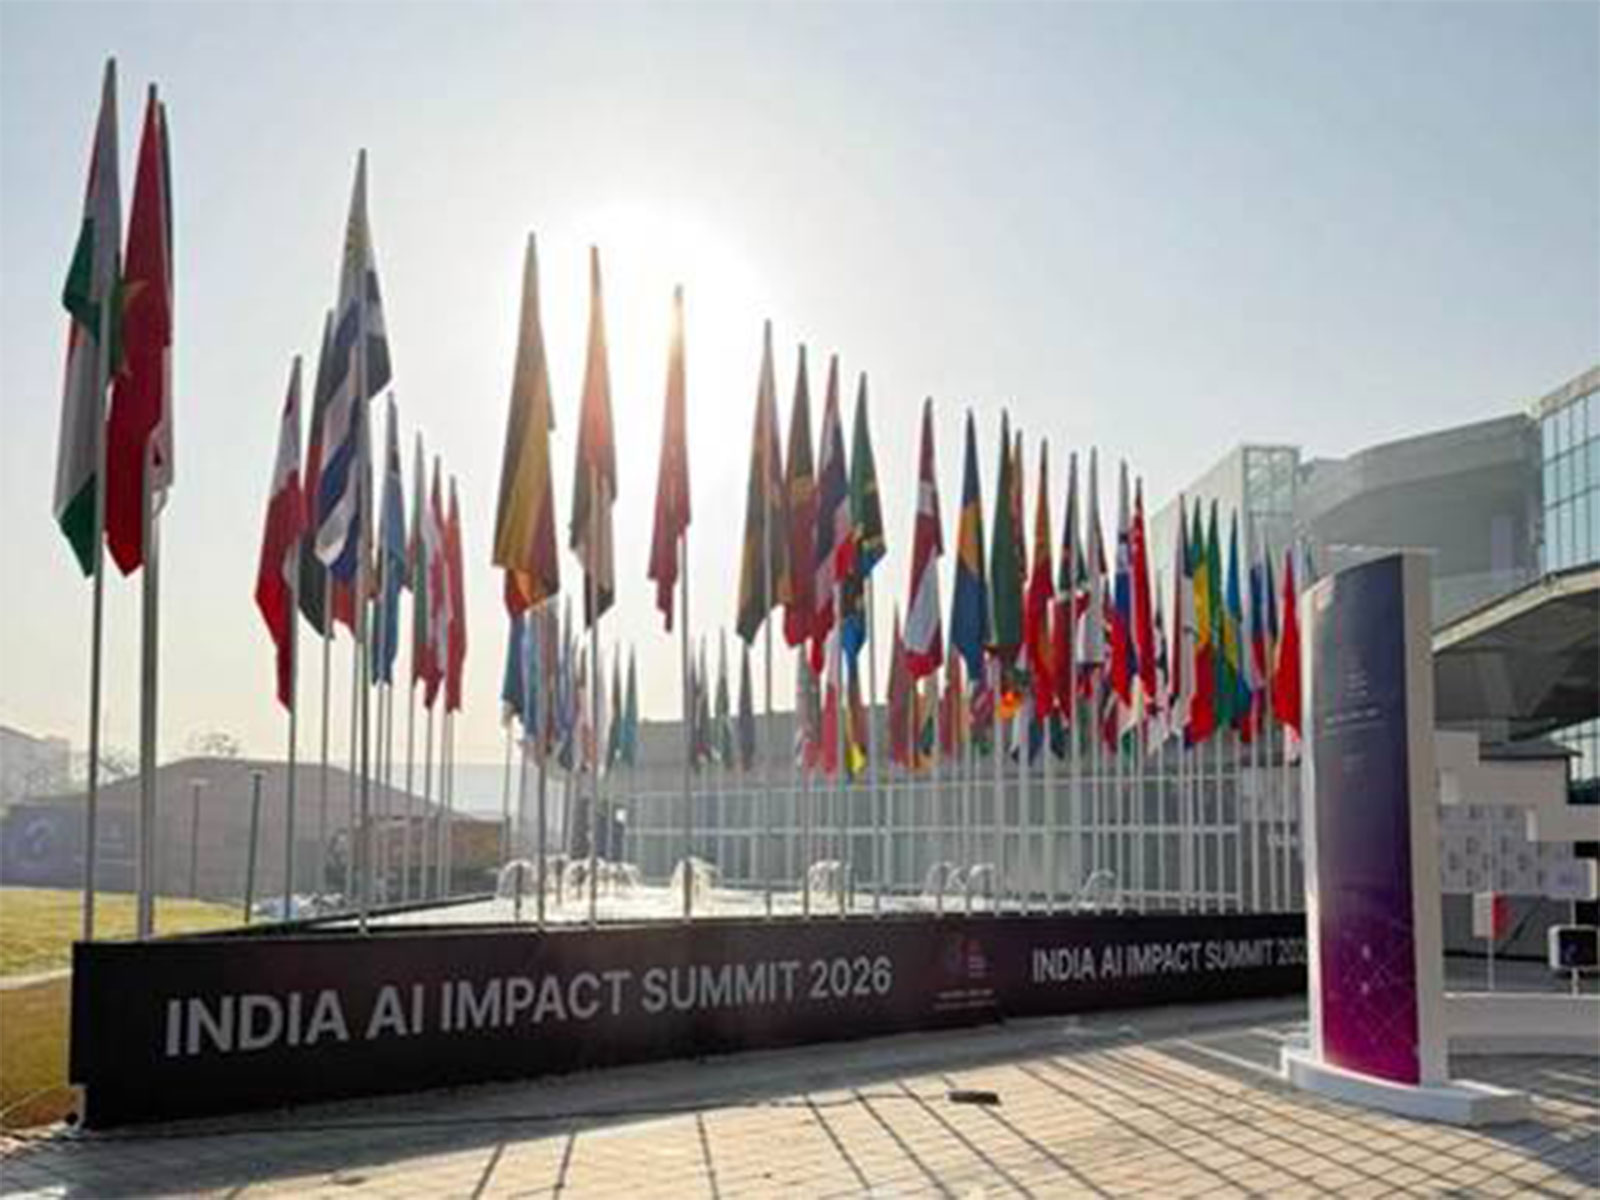
IndiaAI Mission 2.0
- 17 Feb 2026
In News:
IndiaAI Mission 2.0, unveiled by the Union IT Minister at the India AI Impact Summit 2026 in Bharat Mandapam, signals a strategic evolution in India’s artificial intelligence policy framework. Moving beyond initial infrastructure building, the renewed mission focuses on indigenous research and development, MSME integration, sovereign AI capabilities, and large-scale diffusion of AI technologies. It aligns technological advancement with domestic economic priorities and the broader vision of positioning India among the world’s leading AI nations.
Strategic Shift: From Capacity Creation to Innovation Diffusion
The first phase of India’s AI efforts emphasized building compute capacity and foundational infrastructure. Mission 2.0 transitions toward:
- Accelerating indigenous AI research and development
- Enabling sector-wide adoption, particularly among MSMEs
- Strengthening domestic value creation across the AI stack
This marks a shift from “infrastructure availability” to “innovation scalability and economic integration.”
MSME-Focused AI Stack: A UPI-Like Model
A key feature of Mission 2.0 is the creation of a common digital AI platform, conceptualized on the lines of the Unified Payments Interface (UPI). The objective is to provide a bouquet of ready-to-use AI tools for micro, small and medium enterprises (MSMEs).
Through this shared platform:
- MSMEs can seamlessly access AI applications.
- Sector-specific solutions will enhance productivity and competitiveness.
- Barriers related to cost and technical complexity are reduced.
Given the centrality of MSMEs in employment generation and exports, embedding AI in this segment can significantly improve global integration and efficiency.
Expanding Compute Infrastructure and Democratizing Access
India plans to expand its AI compute capacity by adding 20,000 GPUs to the existing base of 38,000 GPUs. Unlike models where AI infrastructure is concentrated in a handful of corporations, India’s approach emphasizes broad-based and equitable access.
Several sovereign AI models launched at the summit reportedly performed competitively on global benchmarks, indicating progress in domestic capability building.
This expansion strengthens India’s ability to support startups, academic institutions, and enterprises without overreliance on foreign infrastructure providers.
Investment Momentum and Global Standing
India is now ranked among the top three AI nations globally, according to international assessments such as Stanford’s AI index. The government projects that over $200 billion in investments could flow into the AI ecosystem over the next two years.
These investments are expected across all five layers of the AI stack:
- Hardware (chips and compute)
- Infrastructure
- Foundational models
- Platforms
- Applications
Such capital infusion can catalyse innovation-led growth and job creation.
Sovereign AI: Beyond Model Development
Mission 2.0 broadens the concept of sovereign AI beyond developing domestic language models. It includes:
- Indigenous chip development
- Control over infrastructure and compute systems
- Development of scalable AI applications
The goal is to ensure strategic autonomy and reduce dependence on foreign technological gatekeepers.
AI, Workforce Transition, and Copyright Concerns
Acknowledging concerns about AI’s impact on India’s IT services sector, the government has emphasized upskilling through collaboration among government, industry, and academia.
Additionally, the government supports fair remuneration for news publishers whose content is used to train AI systems. A DPIIT committee has proposed a mandatory blanket licensing framework with statutory royalty provisions potentially making India the first country to institutionalize such a regime.
Conclusion
IndiaAI Mission 2.0 represents a comprehensive policy recalibration—integrating infrastructure expansion, sovereign capability, MSME empowerment, investment mobilisation, and regulatory innovation. By combining technological ambition with inclusive economic objectives, the mission positions AI not merely as a technological tool, but as a driver of structural transformation and strategic autonomy in India’s development trajectory.
Ladakh Telescope Expansion: Advancing India’s Observational Astronomy

- 13 Feb 2026
In News:
The Union Budget 2026 has approved the establishment of two major telescope facilities in Ladakh—the National Large Solar Telescope (NLST) and the National Large Optical–Near Infrared Telescope (NLOT) along with the upgradation of the existing Himalayan Chandra Telescope (HCT).
Operated by the Indian Institute of Astrophysics (IIA), these projects aim to strengthen India’s capacity in frontline space science, solar physics, and cosmology while consolidating Ladakh’s status as the country’s premier astronomy hub.
Ladakh, particularly the Hanle region located at over 4,000 metres above sea level, offers exceptional observing conditions like high altitude, cold desert climate, minimal atmospheric water vapour, and extremely low light pollution. The presence of the Hanle Dark Sky Reserve, India’s first, ensures protection of natural night skies through strict lighting regulations. These factors enable year-round observations, unlike many mainland observatories affected by monsoons, thereby maximizing scientific output.
National Large Solar Telescope (NLST)
The NLST, a 2-metre aperture solar telescope, will be installed near Pangong Tso in Merak. Operating in visible and near-infrared wavelengths, it is expected to be completed within 5–6 years. With a spatial resolution of about 50 km and millisecond-level temporal resolution, NLST will enable high-precision studies of solar dynamics, magnetic fields, flares, and coronal mass ejections.
Understanding these processes is crucial for space-weather forecasting, as solar disturbances can disrupt satellites, communication networks, power grids, and space missions. NLST will complement India’s space-based solar mission, Aditya-L1 (launched in 2023), and join the historic Kodaikanal Solar Observatory (1899) and Udaipur Solar Observatory (1975) as India’s third ground-based solar facility. Strategically, it fills a longitudinal gap in global solar observation networks, enhancing India’s contribution to heliophysics.
National Large Optical–Near Infrared Telescope (NLOT)
The NLOT, to be located in Hanle, will be a 13.7-metre class segmented-mirror telescope, placing it among the world’s largest optical–infrared observatories. Its primary mirror will consist of 90 hexagonal segments functioning as a unified optical surface, enabling collection of faint cosmic light with high precision.
Projected to be operational within a decade, NLOT will facilitate cutting-edge research in exoplanets, stellar and galactic evolution, supernovae, and the origins of the universe. Its infrared capability allows observation of distant and dust-obscured objects, critical for studying early cosmic epochs.
India’s technical expertise gained from its participation in the Thirty Meter Telescope (TMT) project where it contributes mirror segments and segment-support assemblies will aid in constructing NLOT’s advanced optical systems. Importantly, domestic ownership ensures greater observation time for Indian scientists, overcoming the limitations of competitive international access.
Upgradation of the Himalayan Chandra Telescope (HCT)
Operational since 2001, the 2-metre HCT has contributed significantly to transient astronomy, including supernova studies. The planned upgrade to a 3.7-metre segmented mirror system will enhance sensitivity and expand its optical–infrared capabilities. The upgraded HCT will work synergistically with global facilities such as LIGO-India (gravitational-wave observatory in Maharashtra) and the Square Kilometre Array (radio telescope in Australia and South Africa), enabling multi-messenger astronomy.
Significance
Together, NLST, NLOT, and the upgraded HCT represent a transformative investment in India’s scientific infrastructure. They strengthen India’s strategic autonomy in high-end research, support capacity building in precision engineering, and position the country and the Global South more prominently in global astronomy. Complemented by a new COSMOS planetarium in Andhra Pradesh for outreach and education, the initiative reflects a comprehensive vision that integrates research excellence, technological self-reliance, and public scientific engagement.
AI Impact Summit 2026

- 09 Feb 2026
In News:
India will host the AI Impact Summit 2026, marking the first time a major global AI governance forum is being held in the Global South. The summit represents a significant shift in the international discourse on artificial intelligence, from narrow concerns of safety and regulation to broader questions of development, equity, and long-term societal impact.
Evolution of Global AI Governance Forums
The New Delhi summit builds upon a sequence of international engagements on AI governance. The Bletchley Park AI Safety Summit (2023) primarily focused on identifying catastrophic AI risks and resulted in the Bletchley Declaration. The Seoul Summit (2024) expanded the agenda to include innovation and inclusivity, while the Paris AI Action Summit (2025) shifted attention towards implementation and economic opportunities. Each phase has progressively widened the scope from risk containment to practical deployment. India’s summit seeks to carry this evolution forward by anchoring AI governance in developmental priorities.
India’s Distinctive Vision
Unlike earlier summits dominated by regulatory anxieties of advanced economies, India is framing the conversation around “People, Planet, and Progress.” The focus is on deploying AI solutions to address real-world challenges such as employment transitions, sustainability, and service delivery—especially in developing countries. This approach reflects India’s dual identity: an emerging AI power and a representative voice of the Global South seeking a more equitable share in the global AI value chain.
Scale, Participation and Agenda
Described by Union IT Minister Ashwini Vaishnaw as the largest such gathering so far, the summit is expected to witness participation from over 100 countries, including 15–20 heads of government, 50+ ministers, and 40+ CEOs of leading global and Indian technology firms. Narendra Modi will inaugurate the event and engage with global industry leaders through a CEO roundtable.
The summit will follow a multi-stakeholder format, bringing together governments, industry, researchers, civil society, and international institutions. Working groups will deliberate on AI’s impact on jobs, trust and safety frameworks, and sector-specific applications across healthcare, industry, and governance.
India’s Domestic AI Push
A key feature of the summit will be the launch of indigenous AI language models under the IndiaAI Mission (?10,370 crore), including both foundational and small language models. The event will also showcase over 500 AI startups and host around 500 parallel sessions, underscoring India’s ambition to emerge as a global AI innovation hub.
Geopolitics and China’s Participation
India has extended an invitation to China, signalling a pragmatic approach to AI governance despite geopolitical sensitivities. China’s participation follows precedents set at earlier summits and coincides with signs of easing bilateral tensions, such as the resumption of direct flights and partial relaxation of rare-earth export restrictions affecting Indian manufacturers. The summit’s non-binding, host-driven format allows India strategic flexibility in shaping participation.
Structural Constraints: Hardware and Energy
Despite its ambitions, India faces critical constraints. The absence of domestically manufactured advanced computing hardware, particularly GPUs, limits AI self-reliance. Prospective gains from an interim India–US tech trade deal and tax holidays for data centres aim to mitigate this gap. Energy requirements pose another challenge, with the government exploring nuclear power as a long-term solution for energy-intensive AI data centres.
Conclusion
The AI Impact Summit 2026 represents India’s attempt to redefine global AI governance through a development-first lens. By aligning technology with inclusivity, sustainability, and economic opportunity, India seeks not only a larger share of the AI pie but also a more representative and balanced global AI order, one that reflects the aspirations and constraints of the developing world.
Carbon Capture, Utilisation and Storage (CCUS) in India
- 06 Feb 2026
In News:
The Union Budget’s allocation of Rs. 20,000 crore over five years for Carbon Capture, Utilisation and Storage (CCUS) marks a significant policy intervention to address emissions from India’s hard-to-abate industrial sectors. The move reflects a strategic recognition that achieving India’s net-zero emissions target by 2070 will not be possible through renewable energy transition alone, especially amid continued industrialisation and infrastructure expansion.
Understanding CCUS
CCUS refers to a suite of technologies that aim to prevent carbon dioxide (CO2)—the principal driver of climate change from entering the atmosphere. The process involves:
- Capturing CO2 from industrial processes such as cement, steel, power generation, refineries and chemicals
- Transporting CO2 through pipelines or other means
- Storing CO2 securely in deep geological formations, or
- Utilising CO2 by converting it into fuels, chemicals or construction materials
Importantly, CCUS is not a single technology but a value chain involving diverse capture methods, materials, transport systems and storage solutions.
Global Status and Climate Relevance
Although CCUS technologies have existed for decades, global deployment has been limited due to high costs, safety concerns, and scale-up challenges. Currently, only about 50 million tonnes of CO2 are captured annually worldwide—less than 0.5% of global emissions of nearly 40 billion tonnes.
However, with global emissions remaining stubbornly high, climate assessments increasingly agree that there is no credible pathway to limiting global warming or achieving net-zero by 2050 without large-scale CCUS adoption. Consequently, CCUS projects are expanding mainly in the United States, Europe and China.
India’s CCUS Journey
India’s CCUS push gained momentum after it announced its net-zero by 2070 commitment at the 2021 Glasgow climate summit. Since then:
- Pilot and demonstration projects have begun in the steel, cement and chemical sectors
- Potential large-scale capture and geological storage sites have been mapped
- Dedicated Centres of Excellence, such as at Indian Institute of Technology Bombay and Jawaharlal Nehru Centre for Advanced Scientific Research, are leading indigenous research
While the underlying science of CCUS is well understood, significant innovation is still required in engineering design, materials, transport logistics and storage safety to make systems affordable, efficient and scalable under Indian conditions.
Policy and R&D Roadmap
In December, the Department of Science and Technology released a CCUS R&D Roadmap for 2030, identifying key technology, financing and policy bottlenecks that have slowed adoption. A major gap highlighted was the lack of funding for field-level testing and scale-up, where commercial risks are highest.
Significance of the Rs. 20,000 Crore Budget Allocation
The five-year budgetary support is designed to:
- Bridge the “valley of death” between laboratory success and commercial deployment
- Raise technology readiness levels of CCUS systems
- Enable scale-up to capture or store 100–500 tonnes of CO2 per day, which is necessary for economic viability
Experts expect that this funding could allow multiple CCUS technologies to reach commercial deployment within five years, transforming India’s industrial decarbonisation landscape.
Economic and Strategic Benefits
CCUS is particularly critical for hard-to-abate sectors such as cement and steel, where:
- A majority of CO2 emissions arise from chemical processes, not fuel combustion
- Renewable electricity alone cannot eliminate emissions
Accordingly, CCUS represents the only viable large-scale decarbonisation route for these industries.
The Budget explicitly targets CCUS applications in power, steel, cement, refineries and chemicals, which together account for the bulk of India’s industrial emissions.
From a trade perspective, CCUS adoption can help Indian exporters navigate emerging carbon-based trade barriers, such as the Carbon Border Adjustment Mechanism (CBAM) of the European Union. Lower embedded emissions would enhance the global competitiveness of Indian products.
Challenges Ahead
Despite strong policy intent, several challenges remain:
- High upfront capital costs and uncertain returns
- Need for long-term monitoring and liability frameworks for CO2 storage
- Limited transport infrastructure for captured CO2
- Regulatory clarity on ownership and responsibility for stored carbon
Addressing these issues will require coordinated action across ministries, industry, academia and financial institutions.
Conclusion
The Rs. 20,000 crore CCUS allocation represents a structural shift in India’s climate strategy, acknowledging the limits of energy transition alone and embracing industrial decarbonisation technologies. If effectively implemented, CCUS can reconcile India’s development imperatives with its climate commitments, safeguard export competitiveness, and enable a credible pathway towards net-zero by 2070. Sustained policy support, technological innovation and regulatory certainty will determine whether this budgetary push translates into long-term climate and economic gains.
Union Budget 2026–27: Charting India’s Path to Growth, Inclusion and Resilience
- 04 Feb 2026
In News:
The Union Budget 2026–27 was presented in Parliament by the Nirmala Sitharaman, marking her ninth consecutive Budget and the first to be prepared in Kartavya Bhawan. The fiscal blueprint is structured around three core duties or “Kartavyas” that reflect the government’s strategic priorities: accelerating and sustaining economic growth, building human capacities and fulfilling aspirations, and ensuring inclusive development across regions and communities. This framework signals an integrated approach to achieve Viksit Bharat by 2047 amid global uncertainties and domestic structural challenges.
Macro-Fiscal Framework and Priorities
For the financial year 2026–27, the Budget projects total expenditure at ?53.5 lakh crore, with non-debt receipts estimated at ?36.5 lakh crore and net tax receipts at ?28.7 lakh crore. The fiscal deficit is targeted at 4.3% of GDP, marginally lower than the revised estimate of 4.4% for 2025–26, underscoring a continued commitment to fiscal consolidation. The debt-to-GDP ratio is projected to decline to 55.6%, indicating gradual improvement in fiscal metrics.
First Kartavya: Growth, Competitiveness and Infrastructure
The Budget places strong emphasis on strengthening India’s growth engine through investment-led strategies and sector-specific interventions. Public capital expenditure is significantly enhanced to ?12.2 lakh crore, reinforcing the infrastructure build-out across transport, logistics, waterways and urban connectivity. Seven high-speed rail corridors are proposed as growth connectors, while 20 new national waterways are slated to be operational in the coming five years.
Manufacturing and strategic sectors receive focused support. The Biopharma SHAKTI initiative, with an outlay of ?10,000 crore, aims to position India as a global biopharmaceutical hub. The India Semiconductor Mission 2.0 and expanded electronics components manufacturing scheme are designed to enhance technological sovereignty and supply chain resilience. Rare earth corridors in mineral-rich states will facilitate mining, processing and value chain development. Initiatives such as the Textile Expansion and Employment Scheme and Mega Textile Parks will boost traditional and technical textiles through cluster-based financing and technology upgradation.
Special focus is accorded to legacy industry revival, with targeted schemes to modernise 200 industrial clusters, and to developing Champion SMEs backed by a ?10,000 crore growth fund. Infrastructure risk mitigation funds and monetisation of CPSE real estate are expected to catalyse private investment.
Second Kartavya: Human Capital and Aspirational Growth
The second Kartavya underscores investment in human capital. A High-Powered Education–Employment–Enterprise Standing Committee will align skill development with employment outcomes, particularly in services and future sectors. New allied health institutions and regional medical hubs are proposed to strengthen healthcare capacity and position India as a medical tourism destination. Traditional systems of medicine will be reinforced with new institutes for Ayurveda.
Education infrastructure will be expanded with university townships near industrial corridors and girls’ hostels across districts to improve access and equity. Creative industries under the Orange Economy will be catalysed through AVGC labs in schools and colleges, targeting employment generation in animation, gaming and visual effects.
Third Kartavya: Inclusive Development and Last-Mile Participation
Inclusivity is central to the third Kartavya. Major schemes are unveiled to boost farm incomes, including integrated development of reservoirs, a Coconut Promotion Scheme and Bharat-VISTAAR, an AI-enabled multilingual platform to improve agricultural decision-making. Efforts to empower divyangjan through skilling initiatives and the expansion of mental health infrastructure, including NIMHANS-2, reflect a broader social inclusion agenda.
Regional disparities are addressed through targeted infrastructure in Purvodaya States and the North-East, including tourism circuits and e-buses to enhance sustainable connectivity. Fiscal transfers through the 16th Finance Commission amount to ?1.4 lakh crore, reinforcing cooperative federalism.
Conclusion
The Union Budget 2026–27 balances growth imperatives with inclusive outcomes, reinforcing infrastructure, manufacturing, human capital, and regional equity. Anchored in the Three Kartavyas, it strives to consolidate India’s macroeconomic stability while enabling citizens to actively participate in and benefit from the development process.
Union Budget 2026–27: Growth, Inclusion and Structural Transformation
- 02 Feb 2026
In News:
The Union Budget 2026–27 is anchored in a threefold developmental framework accelerating economic growth, building human capacity, and ensuring inclusive participation. At a time when the global economy faces supply chain realignments, technological disruption, and resource insecurity, the Budget attempts to position India as a resilient, innovation-driven, and socially inclusive economy.
I. Growth Strategy: Investment-Led and Technology-Driven
A defining feature of the Budget is the continued emphasis on public capital expenditure, raised to ?12.2 lakh crore. This reinforces the government’s belief that infrastructure spending crowds in private investment, enhances productivity, and generates employment.
The push spans:
- High-speed rail corridors and freight infrastructure
- Expansion of National Waterways for cost-effective logistics
- Development of City Economic Regions (CERs) to leverage urban agglomeration benefits
These measures reflect a shift from isolated project-based development to integrated regional growth planning.
The Budget also promotes strategic manufacturing and high-technology sectors. The Biopharma SHAKTI initiative (?10,000 crore outlay) aims to develop domestic capabilities in biologics and biosimilars, reducing import dependence while addressing India’s rising non-communicable disease burden. This aligns with the broader push toward knowledge-intensive industrialisation.
Simultaneously, the ?10,000 crore SME Growth Fund recognises MSMEs as drivers of employment and innovation, moving beyond survival support toward scaling globally competitive firms.
II. Human Capital: From Demographic Dividend to Skilled Workforce
The Budget acknowledges that economic growth without skill formation risks jobless expansion. Hence, it invests in education, skilling, and sector-specific workforce creation.
- AVGC labs in schools and colleges support India’s emerging digital content industry.
- Establishment of girls’ hostels in STEM districts addresses gender gaps in higher education.
- A National Institute of Hospitality and guide training scheme link skilling with tourism-led growth.
Healthcare is treated not only as welfare but also as an employment-intensive care economy. The proposal for Regional Medical Hubs integrates healthcare delivery, research, and medical tourism, positioning India as a global health services destination.
III. Inclusive Growth and Social Sector Interventions
The third pillar of the Budget centres on inclusion. Schemes such as Bharat VISTAAR, an AI-based multilingual agricultural advisory, aim to democratise digital infrastructure for farmers, thereby reducing information asymmetry and climate risk.
Similarly, SHE-Marts build on SHG-based mobilisation to promote women’s entrepreneurship, signalling a shift from credit access to market integration and enterprise ownership.
Mental health infrastructure expansion, regional development in the Northeast, and targeted tourism circuits indicate an attempt to address geographical and social imbalances.
IV. Fiscal Prudence with Growth Orientation
Despite higher expenditure, fiscal consolidation remains on track:
- Fiscal deficit projected at 4.3% of GDP
- Debt-to-GDP ratio on a declining trajectory
This suggests a calibrated approach where growth-enhancing capex is prioritised while maintaining macroeconomic credibility.
V. Tax Reforms: Simplification and Competitiveness
The introduction of the New Income Tax Act (2025) aims to simplify compliance and reduce litigation. Rationalisation of penalties, decriminalisation of minor offences, and automated safe harbour provisions for IT services improve the ease of doing business.
In a bid to attract global capital, tax incentives for data centres, cloud services, and non-resident investors indicate a strategy to integrate India into global value chains in digital and high-tech domains.
VI. Trade Facilitation and Industrial Policy
Customs reforms reduce duties on inputs for critical minerals, clean energy, aviation, and pharmaceuticals, supporting domestic manufacturing. Digitisation of cargo clearance, AI-based risk assessment, and warehouse reforms enhance trade efficiency and logistics competitiveness.
Conclusion
The Union Budget 2026–27 reflects a structural transition in India’s development model—from consumption-led growth to investment, innovation, and inclusion-led expansion. By combining infrastructure investment, industrial policy, human capital formation, and digital governance, the Budget attempts to align short-term growth impulses with the long-term goal of Viksit Bharat. The key challenge lies in effective implementation and coordination with states, which will determine whether these ambitions translate into broad-based socio-economic transformation.
Strengthening India’s Statistical Ecosystem: MoSPI’s Initiative to Develop a Robust District Domestic Product (DDP) Framework

- 02 Nov 2025
In News:
India’s statistical architecture is undergoing a major transformation as the Ministry of Statistics and Programme Implementation (MoSPI) moves toward developing a bottom-up District Domestic Product (DDP) framework.
The initiative seeks to address long-standing limitations in district-level economic measurement by integrating two critical datasets—the Annual Survey of Unincorporated Sector Enterprises (ASUSE) and the Periodic Labour Force Survey (PLFS). Beginning January 2025, the combined use of these datasets aims to provide more accurate, granular and timely insights into India’s local economic activity, enabling evidence-based policymaking at the district level.
For decades, most states have relied on top-down allocation methods to estimate DDP, proportionately distributing Gross State Domestic Product based on outdated demographic indicators such as population. This approach produces “near-identical growth rates across districts”, obscuring regional disparities. Recognising this gap, MoSPI has initiated a shift toward a bottom-up estimation model in partnership with state governments. By directly capturing enterprise-level and labour market data from each district, the new framework is expected to radically improve the precision of district economic accounts.
The ASUSE forms the backbone of this strategy. Covering the unincorporated non-agricultural sector—which includes micro, household-based and small enterprises across manufacturing, trade and services—ASUSE produces detailed information on operations, investment patterns, workforce size and value addition. Previously released annually, the survey now offers quarterly data, enhancing frequency and granularity. Given the dominance of the unorganised sector in India’s economy, ASUSE provides an indispensable window into local economic activity.
The PLFS, conducted monthly by the National Statistical Office (NSO), complements ASUSE by capturing labour force participation, employment conditions, earnings and occupational structures in both rural and urban areas. Together, the two datasets reflect the dual pillars of district economies—enterprise activity and labour engagement. MoSPI notes that large enterprises are easy to identify, but district-level output is primarily driven by households, nano units and MSMEs, which both surveys cover extensively.
By combining these datasets, MoSPI aims to compute DDP through:
(a) bottom-up aggregation of district-level enterprise and labour data;
(b) integration of informal sector output; and
(c) alignment of statistical systems with decentralised planning structures.
This marks a paradigm shift in India’s economic measurement, aligning with the government’s emphasis on data-driven governance under Viksit Bharat @2047.
The initiative is part of a broader overhaul of the statistical system. Several complementary efforts are underway:
- The Annual Survey of Service Sector Enterprises (ASSSE), launching in January 2026, will map the incorporated services sector.
- The National Household Income Survey (NHIS), beginning February 2026, aims to measure income distribution and inequality—despite traditional challenges of under-reporting.
- A forward-looking capital expenditure survey has been introduced to track investment trends.
- MoSPI is also expanding public access to over 250 datasets, including GST aggregates, e-Vahan registrations and trade statistics, to strengthen national accounts and support research.
Despite these advancements, challenges remain. Accurate data capture from unincorporated enterprises is difficult, statistical capacity varies across states, and integrating multiple datasets raises risks of double-counting. Yet experts view the reform as a critical step toward improving the granularity, reliability and timeliness of India’s economic statistics. With several states already experimenting with district-level estimation, MoSPI’s framework could soon enable standardised and credible DDP measurement nationwide, transforming local governance and development planning.
The Employability Crisis in India: Rethinking Academia–Industry Collaboration

- 01 Nov 2025
In News:
India is grappling with a growing employability crisis, underscored by the fact that only 42.6% of graduates are considered job-ready. This mismatch between academic training and labour market needs has become a structural challenge, affecting productivity, economic growth, and youth aspirations. The crisis signals a systemic misalignment rather than a shortage of talent.
Understanding Employability
Employability today goes beyond academic qualifications. It includes the ability to:
- Acquire and apply knowledge in real-world contexts.
- Adapt to evolving technologies and workplace demands.
- Engage in lifelong learning, unlearning, and relearning.
- Demonstrate soft skills, value creation, and ethical behaviour.
Modern industries require graduates who combine technical capability with communication, teamwork, problem-solving, and a growth mindset.
Causes of the Academia–Industry Divide
Academic Factors
- Outdated Curriculum: Syllabi often fail to match rapid technological changes, new job roles, and automation trends.
- Theory-Oriented Pedagogy: Learning remains exam-centric with limited exposure to practical projects, internships, or problem-solving environments.
- Soft Skills Deficit: Institutions provide little training in communication, adaptability, workplace behaviour, and emotional intelligence.
Industry Factors
- High Expectations: Employers expect “ready-to-deploy” graduates but invest minimally in onboarding or mentoring.
- Rapid Technological Shifts: Industry skill needs evolve faster than academia can adjust, widening the skills gap.
- Weak Collaboration: Companies often view academic institutions as outdated, resulting in minimal engagement in curriculum design or research.
- Short-Term Approach: Recruitment is prioritised over building robust, long-term skill ecosystems.
Government and Institutional Initiatives
- National Education Policy (NEP) 2020: Encourages experiential learning, flexibility, internships, and stronger industry linkages.
- AICTE Internship Mandate: Requires engineering students to undergo industrial exposure.
- Skill India Mission: Strengthens vocational education through Sector Skill Councils aligned with market needs.
- NASSCOM FutureSkills PRIME: Upskills youth in digital technologies such as AI, data analytics, and cybersecurity.
These initiatives aim to modernise learning pathways and improve alignment with industry demands.
Challenges in Implementation
Despite reforms, several structural challenges persist:
- Curricular Inertia: Bureaucratic hurdles delay rapid updates in university syllabi.
- Fragmented Skills Ecosystem: Weak coordination among government, academia, and industry limits policy effectiveness.
- Faculty Skill Gaps: Many educators lack exposure to new technologies and contemporary workplace practices.
- Urban–Rural Divide: Smaller and rural institutions suffer from poor infrastructure and limited corporate linkages.
- Low Industry Investment: Companies underinvest in academia–industry partnerships and long-term talent development.
Way Forward
- Structural Reforms
- Curriculum Co-Design: Regular, collaborative revision of syllabi with inputs from employers, universities, and policymakers.
- Dual-Learning Model: Embed apprenticeships, live projects, and work-integrated learning into higher education.
- Faculty Immersion: Promote faculty internships, industry sabbaticals, and continuous upskilling.
- Skills and Ethics
- Soft Skills & Ethics Labs: Establish dedicated centres for communication, workplace ethics, and emotional intelligence.
- Outcome-Based Tracking: Use data to monitor alumni career trajectories and skill relevance.
- Industry Engagement: Incentivise long-term corporate participation in curriculum development, research, and training.
Conclusion
India’s employability challenge is fundamentally an issue of alignment, not ability. Bridging the gap between academia and industry requires shared responsibility, continuous innovation, and sustained collaboration. When education becomes practical, dynamic, ethical, and closely connected to the world of work, India can unlock its demographic potential and build a resilient, future-ready workforce.
Reforming India’s Food and Fertiliser Subsidies
- 25 Jun 2025
In News:
India’s food and fertiliser subsidy regime has played a critical role in ensuring food security and supporting farm productivity. However, with extreme poverty declining from 27.1% in 2011 to a historic low of 5.3% in 2022, and the combined food and fertiliser subsidy bill exceeding ?3.5 lakh crore in FY26, there is a growing policy imperative to reimagine these subsidies for greater efficiency, fiscal prudence, and long-term sustainability.
The Current Landscape
Food and fertiliser subsidies in India are a mix of direct and indirect support mechanisms. Direct subsidies include schemes like PM-KISAN, while indirect subsidies include low-cost foodgrains under the National Food Security Act (NFSA) and price-controlled fertilisers. As per government data:
- Food subsidy is budgeted at ?2.03 lakh crore, reaching over 800 million beneficiaries through the Public Distribution System (PDS).
- Fertiliser subsidy is pegged at ?1.56 lakh crore, driven by rising global prices and a skewed demand for urea.
Challenges in the Current Subsidy System
- Mismatch Between Poverty and Coverage: Despite poverty falling to 5.3%, 84% of households still possess ration cards, many of whom are no longer poor. This reflects poor targeting and leads to welfare leakages.
- Nutritional Deficiency in PDS: The PDS remains cereal-centric, primarily distributing rice and wheat, while nutrition insecurity persists due to insufficient supply of pulses, edible oils, and micronutrients.
- Fertiliser Misuse: The overuse of nitrogen-based fertilisers (particularly urea) has caused an ecological imbalance, deteriorating soil health and reducing long-term farm productivity.
- Fiscal Constraints: Massive subsidy expenditures are crowding out investments in rural infrastructure such as irrigation, cold storage, and extension services—critical for doubling farmer incomes.
- Leakages and Ghost Beneficiaries: Despite digitisation and Aadhaar seeding, leakages continue in both PDS and fertiliser channels, with instances like card cancellations in Jharkhand pointing to persistent inefficiencies.
Government Initiatives So Far
- PMGKAY during COVID-19 extended free foodgrains to NFSA beneficiaries, and has now been merged with NFSA provisions.
- Digitisation of ration cards and Aadhaar-enabled ePoS machines are being used to plug PDS leakages.
- Neem-coated urea and the Nutrient-Based Subsidy (NBS) policy aim to reduce misuse and promote balanced fertilisation.
- Direct Benefit Transfer (DBT) for fertilisers is being piloted to streamline subsidy flows and reduce diversion.
Reform Measures Needed
- Targeting and Gradation: Use PM-KISAN, SECC, and Aadhaar-linked databases to better identify the poorest 15% households and gradually taper subsidies for others.
- Digital Food Coupons: Introduce ?700/month digital wallets or coupons for nutrient-rich food purchases (pulses, eggs, milk), improving dietary diversity and nutrition security.
- Fertiliser Coupons & Price Rationalisation: Introduce fertiliser coupons, deregulate prices, and incentivise eco-friendly inputs like bio-fertilisers and organic compost.
- Improve Monitoring: Strengthen data triangulation using land records, crop surveys, and income data to reduce inclusion/exclusion errors.
- Farmer Sensitisation: Communicate the rationale for reforms clearly to farmers to avoid mistrust or resistance, as witnessed during earlier protests.
Conclusion
India’s welfare architecture must evolve with its changing socio-economic landscape. With poverty rates at historic lows, continued universal subsidies are both fiscally unsustainable and inefficient. Smartly targeted reforms in food and fertiliser subsidies are vital for improving nutritional outcomes, restoring soil health, and ensuring optimal allocation of public resources. A calibrated transition to a more efficient, inclusive, and sustainable system will enhance welfare delivery without compromising economic growth.
National Green Hydrogen Mission
- 22 Jun 2025
In News:
India’s green hydrogen sector stands at a critical crossroads. Once buoyed by global enthusiasm for clean fuels, it now faces export-related headwinds due to geopolitical uncertainties and wavering international policy commitments. In response, India has strategically pivoted toward building a robust domestic ecosystem to ensure long-term energy security and decarbonisation.
National Green Hydrogen Mission
Launched in 2023, the National Green Hydrogen Mission aims to establish India as a global green hydrogen hub. With an outlay of ?19,744 crore, the mission targets the production of 5 million metric tonnes (MMT) of green hydrogen by 2030, along with domestic manufacturing of electrolysers under the SIGHT (Strategic Interventions for Green Hydrogen Transition) programme.
To ensure credibility and transparency, the Ministry of New and Renewable Energy (MNRE) introduced a measurement and certification framework in April 2025 to verify green hydrogen at the production stage. These foundational steps are essential for market integrity, both domestically and internationally.
Export Slowdown: Policy and Geopolitical Challenges
India’s early ambitions to become a major green hydrogen exporter have been hampered by global developments. Projects like ReNew’s green ammonia facility in Odisha face uncertain prospects due to declining international demand. Contributing factors include policy uncertainty in key markets like the United States, where a potential rollback of the Inflation Reduction Act (via the “Big Beautiful Bill”) threatens long-term clean energy investments.
Moreover, European procurement initiatives, such as Germany’s Hintco under the H2Global Foundation, have seen low industry response, reflecting weak investor confidence. In response, India has initiated talks with European ports like Rotterdam and Antwerp, and is pushing for FTA provisions to lower import duties on green hydrogen, aiming to keep future export channels open.
Domestic Market Creation:
Faced with uncertain exports, India is actively cultivating domestic demand. A recent tender for 8 lakh tonnes of green hydrogen received full bids, indicating growing interest from Indian firms. The Solar Energy Corporation of India (SECI) is managing another tender for 7 lakh tonnes, primarily for the fertiliser sector.
Pilot initiatives are also being deployed in sectors such as steel, shipping, and transportation. For example, hydrogen fuel cell buses are being tested in five cities, including Ladakh. Industry experts advocate for mandatory blending in sectors like fertilisers to accelerate adoption.
Cost Competitiveness: The Core Challenge
At present, green hydrogen costs $4–$5 per kg, significantly higher than $2.3–$2.5 per kg for grey hydrogen. A report by CII, Bain & Co., and RMI attributes this to immature supply chains, high capital costs, and limited scale. The report recommends pragmatic interventions such as:
- Blending green hydrogen into existing grey hydrogen or natural gas systems.
- Promoting uptake in niche sectors like ceramics and chemicals.
- Public procurement of green steel to create economies of scale.
Conclusion:
While India’s long-term vision to lead the green hydrogen transition remains intact, current challenges necessitate a strategic rebalancing. Prioritising domestic demand creation, infrastructure development, and cost reduction over near-term exports will be key. If implemented effectively, India may replicate its renewable energy success, positioning itself as a global leader in green hydrogen by the next decade.
The Rising Cost of Imports: A Concern for India's Food Security and Farmers
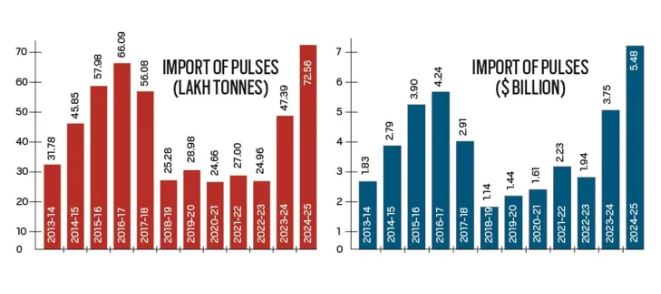
- 21 Jun 2025
In News:
India’s increasing dependence on imports of pulses and edible oils has raised serious concerns about agricultural sustainability, trade deficits, and farmer welfare. Despite policy claims of self-reliance in agriculture, recent trends highlight structural imbalances in domestic production and pricing mechanisms, especially for pulses and oilseeds.
Farmers at the Receiving End
Farmers cultivating pulses and oilseeds, such as moong, chana, masoor, and soyabean, are struggling due to poor price realization and lack of systematic procurement at Minimum Support Prices (MSP). Rao Gulab Singh Lodhi, a farmer from Madhya Pradesh, harvested 90 quintals of moong in summer 2025. Despite an MSP of ?8,682/quintal, he had to sell his produce in the open market at ?6,000/quintal due to the absence of procurement infrastructure. Soyabean prices, too, are well below MSP, selling at ?4,100–4,200/quintal against an MSP of ?5,328 (for 2025–26).
Unlike rice and wheat, for which procurement is extensive and assured, pulses and oilseeds lack institutional support, even in regions where agro-climatic conditions favour their cultivation. This discourages farmers from growing these critical crops, despite using high-yielding and climate-resilient varieties.
Pulses: From Self-Reliance to Import Surge
India witnessed a record 7.3 million tonnes (mt) of pulses imports worth $5.5 billion in 2024–25, surpassing the previous high of 6.6 mt in 2016–17. This comes after years of reduced imports, thanks to improved domestic production which had peaked at 27.3 mt in 2021–22.
However, the El Niño-induced drought in 2023–24 brought down production to 24.2 mt, leading to higher retail inflation in pulses and prompting duty cuts on imports. While these imports helped control prices—with CPI inflation in pulses falling to –8.2% by May 2025—they also depressed mandi prices. In Maharashtra, arhar and chana are currently trading below MSPs, impacting farmer incomes.
Major pulse imports in 2024–25 included:
- 2.2 mt of yellow/white peas (Canada, Russia),
- 1.6 mt of chana (Australia),
- 1.2 mt each of arhar and masoor (Africa, Canada, Australia),
- 0.8 mt of urad (Myanmar, Brazil).
Edible Oils: Worsening Import Dependency
India’s vegetable oil imports more than doubled in a decade—from 7.9 mt in 2013–14 to 16.4 mt in 2024–25. In value terms, imports jumped from $7.2 billion to $20.8 billion, driven partly by global supply disruptions (e.g., Russia-Ukraine war) and high domestic consumption.
India now imports over 60% of its edible oil needs, with palm (7.9 mt), soyabean (4.8 mt), and sunflower oil (3.5 mt) forming the bulk. In May 2025, CPI inflation for vegetable oils stood at 17.9%. In response, the Centre slashed import duties on crude palm, soyabean, and sunflower oil from 20% to 10%, reducing the overall tariff to 16.5%.
While the move may lower consumer prices, industry bodies like the Soyabean Processors Association of India have warned it will "flood the market with cheap imports", making domestic oilseed cultivation less viable. Farmers may shift to alternative crops in the coming kharif season, further weakening India’s self-sufficiency goals.
Conclusion
India’s growing import reliance for essential food commodities like pulses and edible oils, coupled with poor farm-level price realization and weak procurement systems, undermines the objectives of food security and self-reliance. Sustainable import substitution must be driven by robust domestic production incentives, fair pricing mechanisms, and resilient procurement frameworks—especially for non-cereal crops.
Why Governments Revise GDP Base Year and Why India’s 2026 Revision Matters

- 20 Jun 2025
Context:
The Gross Domestic Product (GDP) is the most critical metric used to measure the size and performance of a country’s economy. The "base year" is the reference year against which future GDP growth is calculated. India’s current GDP base year is 2011–12. The government, through the Ministry of Statistics and Programme Implementation (MoSPI), is now preparing to revise it to 2022–23, with the updated series to be released in February 2026.
Why GDP Base Years are Revised
Base year revisions are necessary to reflect structural changes in the economy, incorporate improved and updated data sources, and align with global statistical standards. GDP calculation, by its definition—the market value of all final goods and services produced in an economy—requires accurate, timely, and sectorally-relevant data. However, India’s economy evolves rapidly, particularly with the expansion of the services sector and changes in consumption, production, and labour patterns.
Past revisions (seven since 1948-49) reflect efforts to modernize methodology and include newer data sources, such as the shift from decennial Census-based workforce estimates to five-yearly Employment-Unemployment Surveys by the NSSO. This aligns with the National Statistical Commission’s recommendation of rebasing economic indices every five years.
The last revision occurred in 2015 (base year changed to 2011–12), following which methodological changes attracted controversy. Experts, including former Chief Economic Advisor Arvind Subramanian, argued that the revised methodology overestimated India’s GDP growth, especially in manufacturing, due to reliance on corporate database MCA-21 over the traditional Annual Survey of Industries.
Why the 2026 Revision Is Crucial
The 2026 revision comes after India missed a base year update in 2017–18 due to data-related concerns. Two key surveys—the Consumer Expenditure Survey (CES) and the Periodic Labour Force Survey (PLFS)—faced credibility and methodological challenges. The 2017-18 CES suggested rising poverty, while the PLFS showed a 45-year high in unemployment—trends contrary to government narratives. These issues led to scrapping the proposed 2017–18 base year.
Additionally, disruptive policy changes like demonetisation (2016) and the rollout of GST (2017), followed by the COVID-19 pandemic, meant the following years were not "normal" reference points. The 2022–23 base year is likely to mark the first post-pandemic stable year suitable for a revised series.
This revision is especially significant as India is poised to become the world’s third-largest economy by nominal GDP. At such a juncture, the quality, accuracy, and global credibility of GDP data will directly influence investor confidence, credit ratings, and policymaking.
The base year revision will also extend to other indicators: the Index of Industrial Production (IIP) will be revised to 2022–23, and the Consumer Price Index (CPI) to 2023–24. These changes ensure that inflation and industrial output metrics remain reflective of present-day consumption and production structures.
Conclusion
Revising the GDP base year is not merely a technical exercise—it is central to economic governance. The upcoming 2026 revision must restore faith in India's statistical systems, offer a transparent methodology, and align with international best practices. Its credibility will shape India’s economic narrative for the decade to come, both domestically and on the global stage.
India’s Aviation Safety Oversight: Global Recognition Amid AI-171 Crash Investigation
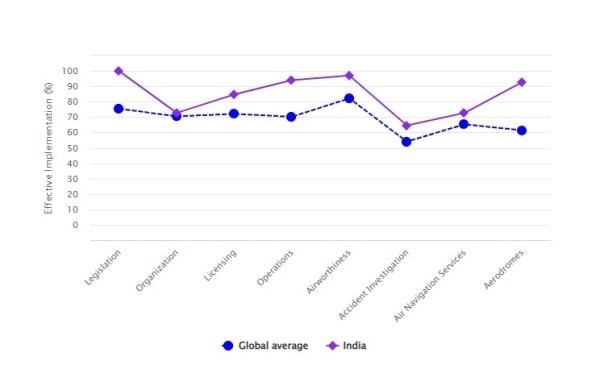
- 18 Jun 2025
In News:
The recent crash of Air India flight AI-171 in Ahmedabad, claiming 241 lives, marks the deadliest aviation accident in India in over a decade. As investigations proceed, the spotlight is on India’s aviation safety standards and regulatory preparedness, particularly the role of the Directorate General of Civil Aviation (DGCA) and India’s standing in global aviation safety audits.
India has received commendable recognition from two premier global aviation oversight bodies: the International Civil Aviation Organization (ICAO) and the US Federal Aviation Administration (FAA). These ratings assume greater relevance now, as the Aircraft Accident Investigation Bureau (AAIB) leads the probe into the Air India crash, in coordination with international stakeholders.
ICAO’s Positive Evaluation of India’s Aviation Oversight
In its 2022 audit under the Universal Safety Oversight Audit Programme (USOAP), the ICAO rated India’s overall Effective Implementation (EI) score at 85.65%, a sharp improvement from 69.95% in 2018. India outperformed the global average across all eight USOAP parameters—legislation, organisation, licensing, operations, airworthiness, accident investigation, air navigation services, and aerodromes.
In two critical areas, India scored remarkably high:
- Operations: India scored 94.02%, compared to the global average of 72.28%, and even surpassed the US (86.51%) and China (90%).
- Airworthiness: India achieved 97.06%, again ahead of the US (89.13%) and China (94.83%).
These ratings reflect significant reforms in civil aviation governance and oversight mechanisms. India’s regulatory capabilities are aligned with ICAO protocols, demonstrating strong institutional capacity to manage operational safety and technical compliance in aviation.
FAA's Endorsement: Retaining Category 1 Status
Further affirming India’s safety standards, the FAA retained India’s Category 1 status in April 2023 after a comprehensive audit in 2021 of DGCA’s oversight in aircraft operations, airworthiness, and personnel licensing. This classification means that India complies with international safety norms under the Chicago Convention and allows Indian carriers to expand operations to the US and enter into code-share agreements with American airlines.
The FAA acknowledged DGCA’s consistent improvement and commitment to safety, especially considering India’s rapid aviation growth—it is the world’s third-largest domestic aviation market and the fastest-growing among major economies.
Multinational Collaboration in Crash Investigation
In the wake of the AI-171 crash, a multi-agency probe has been launched. The AAIB, as per ICAO norms, is leading the investigation. The US National Transportation Safety Board (NTSB) and the UK’s Air Accidents Investigation Branch (AAIB-UK) are involved due to the aircraft’s American origin (Boeing), and the presence of British citizens onboard. Boeing and engine manufacturer GE will also assist in the investigation, adhering to ICAO’s investigation protocols.
Conclusion
India’s strong global safety ratings by ICAO and FAA underscore the DGCA’s enhanced regulatory performance and the country’s growing credibility in civil aviation safety. However, the tragic AI-171 crash serves as a reminder that even well-rated aviation systems must remain vigilant, responsive, and transparent—especially in post-crisis investigations.
Scaling India's Apparel Sector for Export Growth
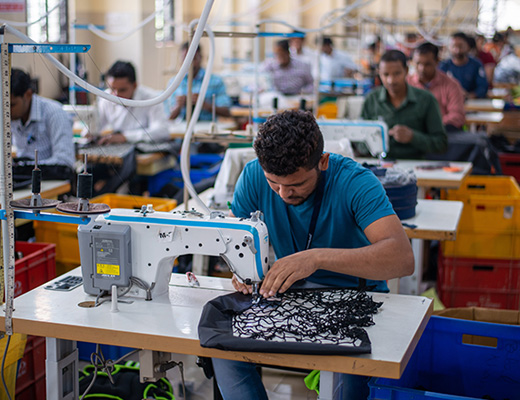
- 10 Jun 2025
In News:
India’s textiles and apparel (T&A) sector is one of its oldest and most employment-intensive industries, contributing 2.3% to GDP and employing over 45 million people, making it the second-largest employer after agriculture. Despite this, India’s share in global apparel trade has remained stagnant at around 3% for two decades—far below its potential. With global apparel trade at $529.3 billion, India’s contribution stands at just $15.7 billion, and the ambitious target of $40 billion in exports by 2030 remains distant unless bold structural reforms are initiated.
Structural Challenges
The fragmentation of the industry is a major bottleneck. Over 80% of apparel units are MSMEs, operating with limited scale, informal labour, and poor integration. In contrast, countries like China, Vietnam, and Bangladesh have achieved scale by setting up large, export-oriented factories or coordinated "buying houses" to pool capacity.
India’s cost of capital (≈9%) also hampers competitiveness, compared to 3–4.5% in China and Vietnam. Further, rigid labour laws, such as mandatory 2x overtime pay, discourage formal employment. Supply chains are dispersed, increasing delivery timelines and logistics costs. These issues are compounded by low female labour force participation, despite women comprising 70% of the workforce in leading apparel hubs.
Success Story: Shahi Exports
The example of Shahi Exports illustrates what is achievable with scale, professionalism, and inclusive practices. From a 15-member unit in 1974, it has evolved into India’s largest apparel exporter, employing over 100,000 workers (70% women) across 50+ factories in 8 states, with over $1 billion in revenue. It shows that Indian firms can scale and compete globally, but organic growth alone is too slow to meet national export goals.
Policy Reforms: A Way Forward
To unlock the sector’s full potential, transformative policy measures are required:
- Capital Access for Scale: A 25–30% capital subsidy and a 5–7 year tax holiday for units with 1,000+ machines would help achieve viable scale. Linking incentives to size, as proposed under PLI 2.0, is essential.
- Flexible Labour Norms: Labour reforms, such as rationalising overtime pay to 1.25x (ILO standard), and easing compliance can encourage formal hiring. Linking MGNREGA funds (25–30%) to wage subsidies in garment units can promote productive, formal employment.
- Skilling for Demand: Schemes like SAMARTH should be expanded for short-cycle, demand-driven training, especially for women and youth, to bridge the skills gap in the sector.
- Cluster-Based Development: At least two PM MITRA Parks should be designated as garment hubs in labour-abundant, low-cost states like Uttar Pradesh and Madhya Pradesh to reduce migration, cut costs, and promote inclusive industrialisation.
- Export-Linked Incentives (ELI): Shift from production-linked to export-linked schemes that reward global competitiveness, not just output.
Conclusion
The apparel sector offers a rare opportunity to generate mass employment, promote inclusive growth, and boost exports. But without scale, reforms, and a strategic policy shift, the $40 billion export dream will remain elusive. India must act swiftly to replicate success stories like Shahi Exports, not over decades, but within years. The time for bold policy innovation is now.
India’s Decline in Extreme Poverty: A Decade of Significant Gains
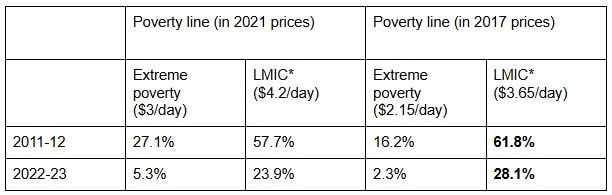
- 08 Jun 2025
In News:
According to the latest World Bank estimates, India’s extreme poverty has sharply declined from 27.1% in 2011-12 to 5.3% in 2022-23, based on an updated $3/day consumption threshold adjusted for 2021 purchasing power parity (PPP). In absolute terms, the number of extremely poor people has reduced from 344.47 million to 75.24 million, indicating 269 million people were lifted out of extreme poverty during this period.
The progress is more striking when viewed under the previous poverty line of $2.15/day (2017 prices). Under this standard, the extreme poverty rate fell from 16.2% to 2.3%, translating to a drop in the number of poor from 205.93 million to 33.66 million—a reduction of 172 million individuals.
Even as the poverty threshold was raised globally, India managed to outperform most developing countries. The lower-middle-income (LMIC) poverty rate, measured at a higher threshold of $4.20/day, also fell substantially—from 57.7% in 2011-12 to 23.9% in 2022-23. This decline reduced the number of people under LMIC poverty from 732.48 million to 342.32 million over 11 years.
The fall in poverty occurred despite high inflation during the decade. When adjusted for domestic inflation, even the $3/day threshold (new benchmark) is higher than the inflation-adjusted $2.60/day from previous estimates, making the achievement more credible.
The World Bank estimates also reveal stark differences in poverty distribution:
- The top five populous states—Uttar Pradesh, Maharashtra, Bihar, West Bengal, and Madhya Pradesh—accounted for 65% of extreme poverty in 2011-12, but still made up 54% in 2022-23.
- Rural India still shows significant poverty, with 90% of rural individuals reporting average monthly per capita expenditures below Rs 5,763, and the bottom 5% class spending just Rs 1,677.
- Urban poverty is relatively lower, with 25.78% in the bottom 40%, compared to 45.44% in rural areas.
- Educational attainment remains a strong poverty determinant; in 2022-23, 35.1% of Indians without schooling lived below the LMIC poverty line, compared to 14.9% with post-secondary education.
In terms of non-monetary deprivation, India also recorded improvement. As per the Multidimensional Poverty Index (MPI), which considers factors such as access to education, electricity, water, and sanitation, multidimensional poverty fell from 53.8% in 2005-06 to 15.5% in 2022-23. NITI Aayog estimates it to be 11.28%, down from 29.17% in 2013-14.
To ensure continued tracking, NITI Aayog is planning a new income-based extreme poverty measure with broader consultation. Meanwhile, the Household Consumption Expenditure Survey (HCES) 2023-24 indicates a 45.4% rise in rural consumption and 38% in urban consumption, reinforcing the World Bank’s findings.
Conclusion
India’s remarkable poverty reduction over the last decade reflects successful economic reforms, social welfare schemes, and increased consumption. However, regional, educational, and rural-urban disparities persist, necessitating continued policy focus, data refinement, and inclusive growth strategies.
Kashmir Rail Link: A Strategic and Developmental Milestone
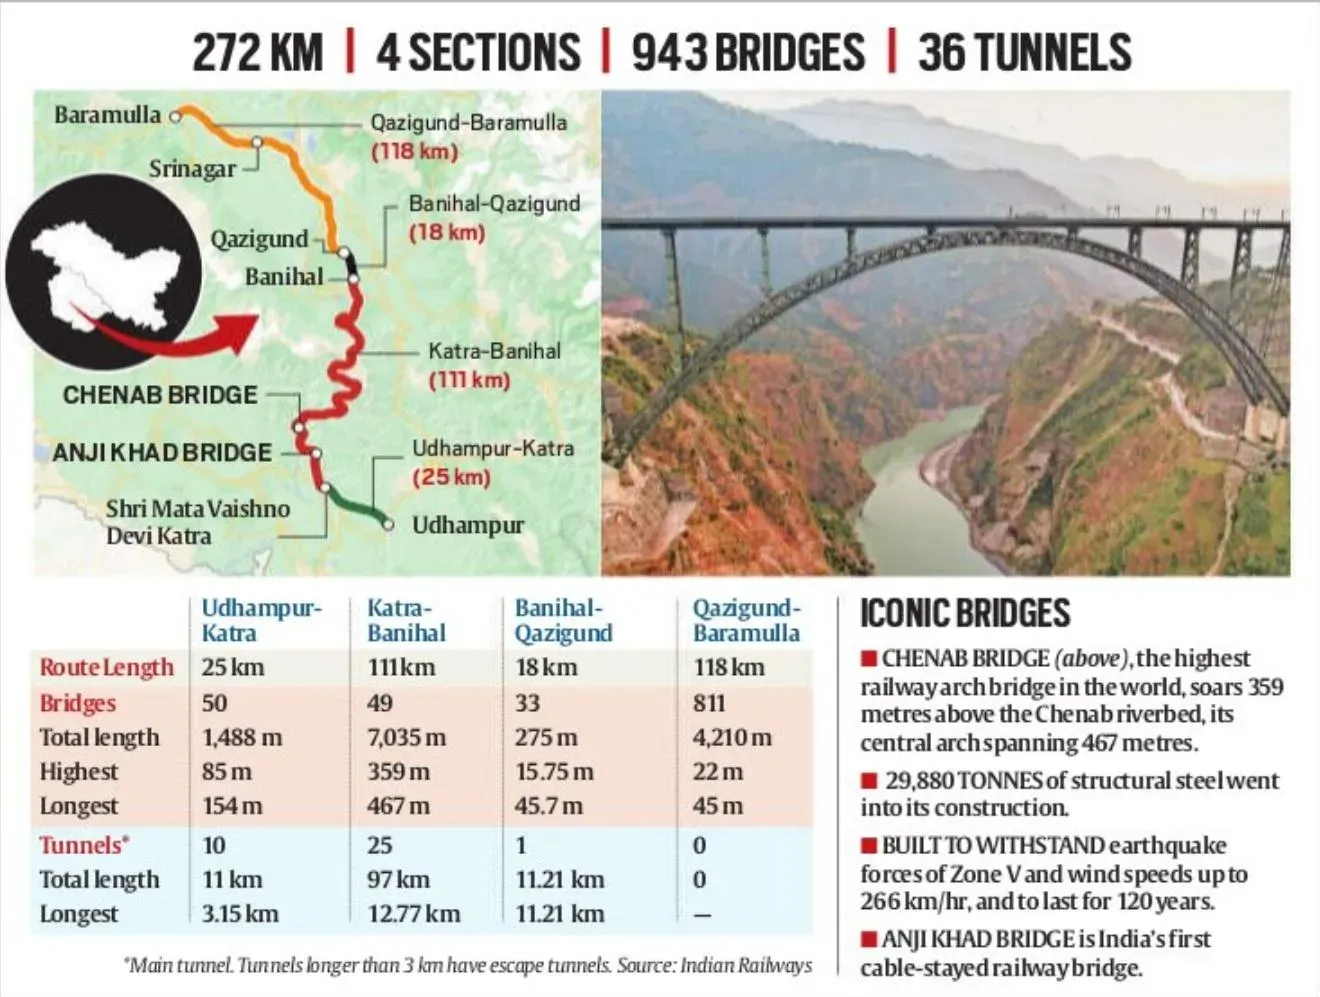
- 07 Jun 2025
In News:
The launch of the Vande Bharat Express between Katra and Srinagar by Prime Minister Narendra Modi marks a transformative chapter in Jammu and Kashmir’s infrastructural journey. The long-awaited completion of the Udhampur-Srinagar-Baramulla Rail Link (USBRL) is not merely a technological feat, but a symbol of national integration, economic upliftment, and inclusive development in the Kashmir Valley.
Historical Background
The evolution of rail connectivity in Jammu and Kashmir dates back to the colonial era when, in 1897, a 40–45 km rail line linked Jammu to Sialkot (now in Pakistan). Subsequent plans to extend railways to Srinagar in the early 20th century were shelved. After the 1947 Partition, Jammu was cut off from the rail grid as Sialkot became part of Pakistan. The region had to wait until 1975 for the inauguration of the Pathankot–Jammu line. The Jammu–Udhampur line, started in 1983, was completed only in 2004.
In 1994, the rail project was further extended to include Srinagar and Baramulla, and the USBRL was declared a national project in 2002, with the initial estimated cost of ?2,500 crore.
USBRL: Engineering Triumph
The fully operational 272 km USBRL has been completed at a revised cost of ?43,780 crore. It includes 36 tunnels, 943 bridges, and several record-setting engineering marvels in the seismically active, snow-covered terrain of the Shivalik and Pir Panjal ranges.
- Chenab Bridge: The world’s tallest railway arch bridge, 359 meters above the riverbed, surpassing even the Eiffel Tower. Designed to withstand wind speeds of 260 km/h and extreme temperatures, it spans 1,315 meters and has a life expectancy of 120 years.
- Anji Khad Bridge: India’s first cable-stayed rail bridge, located in Reasi, towers 331 meters above the river and stretches 725 meters. Its iconic inverted Y-shaped pylon is supported by 96 high-tensile cables.
- Tunnel T-49: At 12.77 km, it is India’s longest transport tunnel, located in Ramban district, designed to ensure seamless all-weather connectivity.
Strategic and Socio-Economic Significance
This rail link is a game-changer for the region. By reducing Katra–Srinagar travel time to just 3 hours, it ensures year-round, all-weather accessibility, even during harsh Himalayan winters. The connectivity is critical not only for civilians but also for the rapid movement of security personnel in this strategically sensitive region.
Economically, the rail link is poised to boost trade and tourism. It will facilitate the quicker and more cost-effective transport of local produce such as apples, walnuts, saffron, pashmina, and handicrafts, thereby integrating the Valley with national markets. Reduced logistics costs will also lower the prices of essential goods imported into Kashmir.
Way Forward
The upcoming extension to Jammu Tawi aims to further enhance nationwide connectivity to Srinagar. This project stands as a testament to India’s commitment to inclusive development, national unity, and strategic infrastructure in border regions. With its blend of engineering excellence and socio-political impact, the USBRL reinforces the vision of a Viksit Bharat that leaves no region behind.
Tiger Conservation in India

- 06 Jun 2025
In News:
India, which hosts over 70% of the world’s wild tiger population, holds a dual responsibility of pride and stewardship. The near-collapse of tiger numbers in 2006, with populations falling to around 1,400 and local extinctions in Sariska and Panna, prompted a national awakening. Strengthened interventions such as the formation of the National Tiger Conservation Authority (NTCA) and Project Tiger rejuvenation efforts helped India register over 3,600 tigers in the 2023 census, reflecting significant progress.
From Crisis to Recovery: Institutional Response
The disappearance of tigers due to poaching, habitat degradation, and poor monitoring led to structural reforms post-2006. The NTCA (established in 2005) ensured stricter protocols, better surveillance, and habitat restoration. India now boasts 53 Tiger Reserves, with central and southern states like Madhya Pradesh, Karnataka, and Uttarakhand emerging as conservation success stories.
Emerging Challenge: Prey Base Decline
Despite rising tiger numbers nationally, several reserves in eastern and central India—such as Guru Ghasidas, Indravati, Udanti-Sitanadi (Chhattisgarh), Palamau (Jharkhand), and Simlipal and Satkosia (Odisha)—have shown worrying trends of tiger decline. The core issue is not direct poaching but the fall in prey density, especially species like chital, sambar, and gaur. Scientific evidence indicates that tiger viability is closely tied to prey abundance, with a threshold of at least 10–15 prey animals per sq km required for stable populations.
Socioeconomic Roots of Ecological Depletion
Many affected reserves lie in poverty-stricken tribal regions. In the absence of alternative protein sources and sustainable livelihoods, communities turn to bushmeat hunting using traditional snares and traps. This not only reduces herbivore populations but also threatens predator survival. Palamau Reserve is a stark example where both large herbivores and tigers have nearly vanished under such pressures.
Institutional Recommendations and Ecological Restoration
The NTCA-WII 2023 report recommends short-term herbivore breeding enclosures but recognizes their limitations in rewilding success. A sustainable solution lies in habitat quality enhancement and involving communities in conservation. Some reserves still retain dense forests, providing an ecological foundation for revival. The decline of left-wing extremism in many areas also opens avenues for focused conservation interventions.
Towards Inclusive Conservation: Eco-Tourism and Livelihoods
Prosperous reserves like Bandhavgarh and Ranthambore benefit from conservation-linked tourism and community participation. In contrast, remote and underdeveloped areas lack such economic linkages. Promoting inclusive eco-tourism, skill development, and income-generation activities—such as SHGs, poultry farming, and forest produce marketing—can transform local attitudes.
Way Forward: Integrated, People-Centric Approaches
India must adopt multidimensional strategies combining ecological, institutional, and social measures:
- Implement prey recovery plans in Tiger Conservation Plans (TCPs).
- Provide targeted funding and technical support to underperforming states.
- Restore grasslands, ensure wildlife corridors, and adopt technology (drones, AI) for monitoring.
- Recognize community forest rights, promote Gram Sabha governance, and expand MGNREGA to conservation-linked jobs.
Conclusion
India’s tiger conservation success is laudable but remains precarious if prey depletion continues unchecked. The path ahead demands a shift from protectionism to participatory conservation—rooted in equity, ecological integrity, and community empowerment. The survival of the tiger is not merely a wildlife concern, but a test of India’s commitment to sustainable development and inclusive environmental governance.
Base Editing Breakthrough

- 29 May 2025
In News:
In a landmark medical feat, a nine-month-old American boy, Kyle “KJ” Muldoon Jr., became the first known human to be successfully treated using base editing, a next-generation gene editing technique derived from CRISPR-Cas9. KJ was born with Carbamoyl Phosphate Synthetase I (CPS1) deficiency, a rare genetic disorder that disrupts nitrogen breakdown, leading to toxic ammonia buildup—known as hyperammonemia—which can be fatal if untreated.
From CRISPR-Cas9 to Base Editing: Evolution of Gene Editing Tools
CRISPR-Cas9, developed in 2012 by Jennifer Doudna and Emmanuelle Charpentier, revolutionized biotechnology and earned them the 2020 Nobel Prize in Chemistry. Modeled after a microbial immune system, CRISPR works by creating “genetic memory”—capturing viral DNA and guiding the Cas9 enzyme, which acts as molecular scissors, to target and cut specific DNA sequences. This enables scientists to eliminate or repair faulty genes by inducing a double-strand break followed by insertion of a corrected DNA sequence.
However, the double-strand break mechanism raised concerns about unintended genetic consequences. Enter base editing, a refined tool that modifies single DNA bases—the letters A, T, C, G—without cutting both strands of the DNA. Instead of scissors and glue, base editing works like a pencil and eraser, replacing one incorrect base pair with the correct one using a fusion of Cas9 and a base-modifying enzyme. In KJ’s case, the specific base mispair causing CPS1 deficiency was successfully corrected using this technique.
Advantages of Base Editing
- Precision and Safety: Avoids double-strand breaks, reducing off-target effects.
- Compactness: Easier to deliver to cells via viral vectors.
- No foreign DNA: Eliminates need for donor DNA insertion.
- Customisation: Suitable for diseases caused by single-nucleotide mutations.
Challenges: Economic, Ethical, and Regulatory
Despite its promise, base editing faces several bottlenecks:
- Cost and Accessibility: The procedure is prohibitively expensive—estimated in the range of hundreds of thousands of dollars—and was funded by research institutions and biotech firms in KJ’s case.
- Scalability: The therapy was custom-designed for KJ’s specific mutation, limiting its use for others. Such personalised medicine lacks the economies of scale that attract pharmaceutical investment.
- Regulatory hurdles: Countries like India face issues of bureaucratic red tape and outdated ethical frameworks that delay the deployment of advanced genomic therapies.
- Ethical concerns: As the technology becomes more powerful, there are concerns about misuse, eugenics, and the potential editing of germline cells.
Conclusion
KJ’s treatment marks a paradigm shift in personalised medicine, highlighting the transformative potential of base editing in addressing rare and otherwise untreatable genetic disorders. However, wider application requires systemic reforms in bioethics, regulatory frameworks, and healthcare infrastructure. To ensure equitable access, future efforts must focus on cost reduction, public funding, global collaboration, and ethical oversight. If successfully scaled, base editing could revolutionise medicine for millions suffering from rare genetic diseases.
NITI Aayog Recommends Dedicated Credit Support and Reforms to Boost Medium Enterprises

- 28 May 2025
In News:
Medium enterprises (MEs), a vital yet under-recognized segment of India’s MSME ecosystem, have long faced significant challenges, especially in accessing affordable and timely credit. Though they constitute only about 0.3% of registered MSMEs, medium enterprises contribute nearly 40% of MSME exports, highlighting their critical role in India’s industrial growth and global trade competitiveness.
Significance of Medium Enterprises in the Indian Economy
The MSME sector as a whole contributes around 29% to India’s GDP and employs over 60% of the workforce. However, while micro and small enterprises dominate in number (97% and 2.7% respectively), medium enterprises represent a minuscule share by count but a disproportionately large share in exports and innovation. Medium enterprises have a turnover range of ?100–500 crore and investment in plant and machinery between ?25–125 crore, as per the revised FY26 classification norms announced in the Union Budget 2025-26.
Credit Gap and Financing Challenges
NITI Aayog’s 2025 report, Designing Policy for Medium Enterprises, reveals a credit deficit of approximately $10 billion faced by medium enterprises. This gap stems from institutional biases and structural constraints. Unlike micro units that benefit extensively from priority sector lending, medium enterprises receive fewer such loans and face borrowing costs about 4% higher than those for large companies. Moreover, out of 18 government MSME schemes, only 8 specifically target medium enterprises, which receive less than 18% of total scheme funds (?5,442 crore overall). The absence of dedicated working capital schemes exacerbates liquidity issues, limiting growth and scale-up prospects.
NITI Aayog’s Key Policy Recommendations
- Working Capital Financing Scheme: A sector-specific loan scheme, administered by the Ministry of MSME, is proposed to provide medium enterprises with working capital loans capped at ?25 crore, with individual requests up to ?5 crore. Loans would be linked to enterprise turnover and offered at concessional interest rates, addressing their substantial capital needs.
- Medium Enterprise Credit Card: To meet immediate liquidity requirements—such as payroll, inventory, and equipment maintenance—a credit card facility with a pre-approved limit of ?5 crore is recommended. This facility would follow market interest rates but include a repayment grace period.
- Expedited Credit Disbursal via Retail Banks: Leveraging local retail banks for faster fund distribution under MSME ministry supervision aims to reduce bureaucratic delays and enhance timely access to credit.
- Technology and Skilling Initiatives: The report advocates transforming existing MSME technology centres into ‘India MSME 4.0 Competence Centres’ tailored to sectoral and regional demands, spanning industries like engineering, electronics, and specialized manufacturing. It also proposes incorporating medium enterprise-specific modules into entrepreneurship training and skilling programmes to bridge labour skill mismatches.
- Digital Access and Compliance Support: NITI Aayog recommends creating a dedicated sub-portal within the Udyam platform that facilitates scheme discovery, compliance guidance, and AI-powered navigation to help medium enterprises efficiently access government resources.
Broader Structural Challenges
Apart from financing, medium enterprises face low adoption of advanced technologies, limited R&D support, inadequate sector-specific testing infrastructure, and a disconnect between training programmes and industry needs. These gaps impede innovation and scalability.
Strategic Importance and Policy Outlook
NITI Aayog emphasizes that medium enterprises have the potential to be major employment generators and innovation drivers if provided focused policy attention and financial support. Drawing lessons from global examples like Germany’s Mittelstand and Italy’s fashion industry, the report envisions India’s medium enterprises evolving into globally competitive firms over the next decade.
The medium sector’s formal labour structure also makes it key to transitioning India’s economy from informal to formal. Therefore, a coordinated and inclusive policy framework focusing on finance, technology, skill development, and digital infrastructure is vital to unlock this segment’s full potential and enhance India’s industrial competitiveness, export growth, and self-reliance.
India Becomes the 4th Largest Economy
- 26 May 2025
In News:
In a significant milestone for the Indian economy, India has officially surpassed Japan to become the 4th largest economy in the world in nominal GDP terms, as per the IMF World Economic Outlook (April 2025). According to NITI Aayog CEO B.V.R. Subrahmanyam, India’s GDP now stands at $4.19 trillion, marginally higher than Japan’s $4.18 trillion. This marks a historic moment, reflecting a shift in the global economic order and reaffirming India's rising stature on the world stage.
From Fifth to Fourth: A Decade of Accelerated Growth
India’s economic rise has been particularly notable over the past decade. From a GDP of $2 trillion in 2014, India has more than doubled its output to cross the $4 trillion mark in 2025. This rapid expansion has also been accompanied by a sharp rise in per capita income, which has grown from $1,438 in 2014 to $2,880 in 2025. In global rankings, India moved from the 5th position in 2024 to 4th in 2025, overtaking Japan and trailing only the United States, China, and Germany.
Factors Driving the Surge
India’s ascent is the result of multiple structural reforms and policy initiatives undertaken in recent years. Programs such as Digital India, Atmanirbhar Bharat, and the Production Linked Incentive (PLI) scheme have enhanced domestic manufacturing, boosted digital infrastructure, and encouraged self-reliance. The government’s focus on ease of doing business, tax reforms (GST, corporate tax rationalisation), and large-scale infrastructure investment under schemes like Gati Shakti have further catalysed growth.
Despite global trends towards supply chain diversification and reshoring, India continues to attract foreign companies due to its cost-effective labor, large consumer base, and improving logistics. For instance, companies like Apple continue to expand their operations in India, viewing it as a reliable manufacturing hub.
Strategic and Geopolitical Implications
India’s new economic position carries significant geopolitical weight. As the 4th largest economy, India’s influence in global financial institutions, climate negotiations, trade partnerships, and multilateral forums such as G20 and BRICS is set to grow. The achievement enhances investor confidence, thereby potentially increasing foreign direct investment (FDI) inflows.
Domestically, this growth presents an opportunity for addressing structural issues such as unemployment, regional disparities, and income inequality. The challenge ahead lies in ensuring that growth remains inclusive, sustainable, and innovation-driven.
Future Outlook
According to NITI Aayog, India is poised to surpass Germany within the next 2.5–3 years, potentially becoming the third-largest economy globally. For this, sustaining macroeconomic stability, boosting exports, enhancing skill development, and transitioning to a green economy will be crucial.
Conclusion
India’s rise to the 4th largest economy marks a defining moment in its development trajectory. It reflects not just statistical growth, but also the success of structural reforms, demographic potential, and policy resilience. As India prepares for its next leap, balancing economic dynamism with social equity will be the key to truly becoming a global economic leader.
MSMEs in India’s Economic Growth
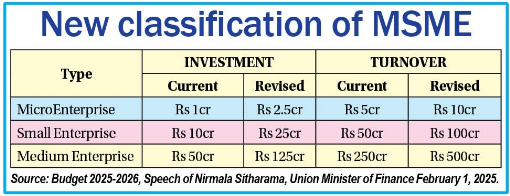
- 07 Feb 2025
In News:
In the Union Budget 2025–26, the Finance Minister proposed a significant policy shift by increasing the investment and turnover limits for MSME classification by 2.5 and 2 times respectively. This move is expected to enhance the growth prospects and scalability of India’s micro, small, and medium enterprises (MSMEs).
Economic Significance:
The MSME sector forms the backbone of the Indian economy, contributing 30% to the GDP and nearly 45% to manufacturing output. With over 1 crore registered units employing 7.5 crore people, it is the largest source of non-agricultural employment in the country. It plays a pivotal role in inclusive development, offering livelihood opportunities to the rural, urban poor, and semi-skilled workforce.
The formalization drive has been significant, with over 4 crore MSMEs registered on the Udyam portal by March 2024. Key schemes like PM Vishwakarma Yojana (?13,000 crore) and Mudra Yojana (?5.41 lakh crore disbursed in FY24) have supported artisans and first-time entrepreneurs, particularly women and marginalized communities.
Boost to Trade and Innovation:
MSMEs account for 45.73% of India’s total exports in sectors like textiles, leather, and engineering goods. Their integration into Global Value Chains (GVCs) is being facilitated by reforms in trade logistics, the GeM portal, and PLI schemes. Digital transformation is advancing rapidly, with 72% MSME transactions now digital, supported by platforms like ONDC and the RBI’s Public Tech Platform.
Women and Rural Empowerment:
Women entrepreneurs constitute 20.5% of Udyam registrations, and 68% of Mudra loans benefit them. MSMEs are also catalyzing rural industrialization by promoting agro-processing and curbing rural-urban migration through schemes like the SRI Fund and Animal Husbandry Credit Guarantee Scheme.
Key Challenges:
Despite their potential, MSMEs face critical bottlenecks:
- Credit access remains limited; only 20% of units access formal finance. Payment delays amounting to ?10.7 lakh crore (2022) hinder working capital.
- Regulatory burdens, inadequate infrastructure, and poor digital skills further constrain productivity.
- Low awareness of schemes and limited integration into global ESG standards affect competitiveness.
- The sector remains largely informal, weakening labor rights and policy outreach.
Recent Reforms & Recommendations:
To unlock MSMEs’ potential, a multi-pronged reform strategy is underway:
- Credit Measures: Promotion of cash-flow based lending, expansion of CGTMSE, Vyapar Credit Cards, and enhanced TReDS-GeM integration.
- Ease of Doing Business: Single-window clearances, self-certification, and stronger MSME facilitation councils.
- Digital & Skill Upgradation: Launch of Digital MSME 2.0, apprenticeship hubs, and innovation incubators.
- Market Access: Expansion of cluster-based models, branding support, and ONDC-GeM integration.
- Green MSMEs: ESG-linked credit, circular economy incentives, and green certifications.
- Formalization Push: Linking benefits to Udyam registration, backed by SIDBI-led equity support.
Conclusion:
MSMEs are central to India’s vision of a $5 trillion economy and Viksit Bharat by 2047. With increased investment thresholds, focused policy interventions, and digital empowerment, India can build a resilient, inclusive, and globally competitive MSME ecosystem.
Rapid Glacial Retreat in Arunachal Pradesh

- 05 Feb 2025
In News:
A recent scientific study has revealed that the eastern Himalayas in Arunachal Pradesh have lost 110 glaciers between 1988 and 2020, highlighting a critical impact of climate change in the region.
Key Findings of the Study
- Glacier Loss: The number of glaciers declined from 756 to 646 over 32 years.
- Glacial Area Reduction: Total glacial cover reduced from 585.23 sq. km to 309.85 sq. km, indicating a loss of over 47%.
- Retreat Rate: Glaciers retreated at a rate of 16.94 sq. km per year.
- Elevation: Most glaciers were located at 4,500–4,800 metres above mean sea level on north-facing slopes of 15°–35°.
- Remote Sensing & GIS: The study used advanced tools along with the Randolph Glacier Inventory to track and analyze glacier boundaries.
- Glacial Lakes: Retreat has led to the formation of numerous glacial lakes, increasing the risk of Glacial Lake Outburst Floods (GLOFs), as seen during the 2023 Sikkim disaster which killed at least 55 people and damaged a 1,200 MW Teesta hydropower project.
Causes of Glacial Retreat
- Climate Change:
- The eastern Himalayas are warming faster than the global average.
- Temperature rise: Between 0.1°C and 0.8°C per decade.
- Over the last century, the region has experienced an increase of ~1.6°C.
- By 2100, projections indicate a 5–6°C temperature rise and 20–30% increase in precipitation.
- Black Carbon Deposition: Emissions from human activities (e.g., vehicles, biomass burning) deposit soot on ice, reducing reflectivity (albedo) and increasing heat absorption.
- Erratic Snowfall Patterns: Changes in precipitation reduce snow accumulation, weakening glacier sustenance.
- Geological Factors: Local topography, altitude, and rock composition also influence glacier stability and response to warming.
Implications of Glacial Retreat
- Water Security
- The Himalayas are known as the ‘Third Pole’, storing the largest volume of ice outside the polar regions.
- They are vital for sustaining over 1.3 billion people in South Asia by feeding major rivers (Indus, Ganga, Brahmaputra).
- Glacial retreat threatens long-term freshwater availability, agriculture, and urban water supplies.
- Hydropower and Infrastructure
- Changing river flow patterns due to glacial melt affect hydropower generation and irrigation systems.
- Risk of infrastructure damage from GLOFs is rising.
- Biodiversity and Agriculture: Altered ecosystems and climatic stress impact Himalayan biodiversity and disrupt traditional farming practices.
Himalayan Glaciers and River Systems
- Indus Basin: Originates from Lake Mansarovar; flows through Ladakh and Pakistan.
- Ganga Basin: Emerges from Gangotri Glacier in Uttarakhand; forms the Ganga after merging with Alaknanda.
- Brahmaputra Basin: Rises near Kailash range in Tibet; flows through Arunachal Pradesh, Assam, and Bangladesh.
Major Glaciers in India
Glacier Region Importance
Siachen Ladakh Longest glacier in India (76 km)
Gangotri Uttarakhand Source of the Ganga
Yamunotri Uttarakhand Origin of the Yamuna
Zemu Sikkim Largest glacier in Eastern Himalayas
Rathong Sikkim Feeds Teesta River
Milam Uttarakhand Source of Goriganga River
Pindari Uttarakhand Glacial trekking route
Glacial Lake Outburst Floods (GLOFs)
- GLOFs are sudden discharges of water from glacial lakes, often caused by moraine dam failures.
- These can trigger catastrophic downstream floods, threatening lives, infrastructure, and ecosystems.
Mitigation and Adaptation Strategies
- Climate Action: Drastic cuts in greenhouse gas emissions at national and global levels.
- Sustainable Water Management: Enhance glacier-fed river basin planning.
- Disaster Risk Reduction: GLOF early-warning systems, resilient infrastructure, and relocation policies.
- Community Participation: Local awareness, traditional knowledge integration, and eco-restoration efforts.
- International Cooperation: Transboundary initiatives under frameworks like the HKH (Hindu Kush Himalaya) Monitoring Network and UNFCCC.
RBI’s Liquidity Infusion of ?1.5 Lakh Crore

- 04 Feb 2025
In News:
In January 2025, the Reserve Bank of India (RBI) announced its largest monetary easing since the COVID-19 pandemic, unveiling a multi-pronged plan to inject over ?1.5 lakh crore into the money markets.
This move aims to address liquidity shortfalls caused by RBI’s forex interventions and signal possible easing in the upcoming monetary policy review.
Context: Why Liquidity Infusion Was Needed
- Forex Intervention: RBI sold over $50 billion from its foreign exchange reserves to stabilise the rupee, in response to large-scale equity sell-offs by Foreign Institutional Investors (FIIs).
- Impact: These interventions reduced rupee liquidity, tightened short-term interest rates, and raised borrowing costs.
- Liquidity Deficit: Market estimates pegged the shortfall at ?3 lakh crore.
Key Liquidity Measures Announced by RBI
- Government Bond Buy-Back: ?60,000 Crore
- Conducted in three tranches on January 30, February 13, and February 20, 2025.
- Objective: To inject liquidity into the banking system by repurchasing government securities before maturity.
- 56-Day Variable Rate Repo Auction: ?50,000 Crore
- Scheduled for February 7, 2025.
- Enables banks to borrow short-term funds by offering government securities as collateral at a market-determined interest rate.
- USD/INR Buy-Sell Swap Auction: $5 Billion
- A six-month forex swap in which RBI borrows dollars in exchange for rupees and agrees to buy them back later.
- Helps stabilize the rupee without draining rupee liquidity.
Significance of the Measures
- Monetary Transmission: With adequate liquidity, any potential repo rate cut will be more effectively transmitted through lower lending rates, boosting investment and consumption.
- Financial Stability: By calming money markets and moderating borrowing costs, RBI strengthens confidence amid global uncertainties.
- Rupee Management without Liquidity Squeeze: The forex swap allows rupee liquidity to remain intact while addressing exchange rate volatility.
Governor’s Focus Areas:
In a meeting with private sector bank heads ahead of the February monetary policy review, RBI Governor Sanjay Malhotra highlighted the following priorities:
- Financial Stability & Inclusion
- Enhanced Digital Literacy and Credit Access
- Improved Customer Service & Grievance Redressal
- Cybersecurity & IT Risk Management
- Monitoring of Third-party Service Providers
- Countering Rising Digital Fraud
Union Budget 2025–26
- 03 Feb 2025
In News:
Union Minister for Finance and Corporate Affairs Smt Nirmala Sitharaman presented Union Budget 2025-26 in the Parliament.
Key Highlights:
Fiscal Policy and Macroeconomic Indicators
- Total Expenditure: ?50.65 lakh crore
- Total Receipts (excl. borrowings): ?34.96 lakh crore
- Fiscal Deficit: 4.4% of GDP
- Gross Market Borrowing: ?14.82 lakh crore
- Capital Expenditure: ?11.21 lakh crore (3.1% of GDP)
Agriculture and Allied Sectors
- Prime Minister Dhan-Dhaanya Krishi Yojana: 100 low-productivity districts targeted; 1.7 crore farmers to benefit.
- Mission for Aatmanirbharta in Pulses: 6-year mission on Tur, Urad, and Masoor; NAFED/NCCF to procure for 4 years.
- Vegetables & Fruits Program: Comprehensive initiative for production, pricing, processing, and logistics.
- Makhana Board: New board in Bihar for production, value addition, and export.
- National Mission on High Yielding Seeds: To commercialize over 100 high-yielding seed varieties.
- Cotton Mission: 5-year initiative to boost productivity and Extra Long Staple (ELS) varieties.
- Fisheries: New EEZ and High Seas Framework focusing on Islands.
- Credit through KCC: Loan limit increased from ?3 lakh to ?5 lakh.
- Urea Plant in Assam: New plant at Namrup (12.7 lakh MT annual capacity).
MSMEs and Startups
- MSME Classification: Investment and turnover limits doubled (2.5x & 2x).
- Credit Cards for Micro Units: ?5 lakh limit; 10 lakh cards in year one.
- ?10,000 Cr Fund of Funds for Startups
- First-Time Entrepreneurs Scheme: Loans up to ?2 crore for 5 lakh women, SC/ST entrepreneurs.
- Footwear & Leather Sector Scheme: Aims ?4 lakh crore turnover and 22 lakh jobs.
- Toy Manufacturing Support: High-quality, eco-friendly toy ecosystem.
- Food Tech Institute: To be established in Bihar.
- National Manufacturing Mission: Across small, medium, and large units.
Infrastructure and Investment
- PPP Pipeline: 3-year project pipeline to be announced.
- ?1.5 lakh crore 50-year interest-free loans to states for CapEx.
- Urban Challenge Fund: ?1 lakh crore outlay; ?10,000 crore for FY26.
- Asset Monetization Plan 2025–30: Capital recycling worth ?10 lakh crore.
- Jal Jeevan Mission: Extended to 2028 with enhanced outlay.
- UDAN 2.0: Targeting 120 new destinations, 4 crore passengers in 10 years.
- Maritime Development Fund: ?25,000 crore; up to 49% govt contribution.
- Nuclear Energy Mission: ?20,000 crore outlay for Small Modular Reactors (SMRs).
- Greenfield Airports: Announced for Bihar.
Welfare and Social Security
- Saksham Anganwadi & Poshan 2.0: Enhanced nutritional cost norms.
- Medical Education: 10,000 new MBBS seats; 75,000 in 5 years.
- Day Care Cancer Centres: In all district hospitals; 200 in FY26.
- PM SVANidhi Revamp: ?30,000 UPI-linked credit cards.
- Online Platform Workers: E-Shram ID, PMJAY coverage.
- Urban Livelihood Scheme: For sustainable urban worker incomes.
Education and Skilling
- 50,000 Atal Tinkering Labs: Govt schools in 5 years.
- Bharatiya Bhasha Pustak Scheme: Digital books in Indian languages.
- National Skilling Centres of Excellence: With global partners.
- AI in Education: Centre of Excellence with ?500 crore outlay.
- IIT Expansion: Additional capacity for 6,500 students.
Innovation and R&D
- ?20,000 crore Innovation Fund (private-led R&D).
- Deep Tech Fund of Funds: For next-gen startups.
- PM Research Fellowships: 10,000 fellowships with higher support.
- 2nd Gene Bank: 10 lakh germplasm lines for food security.
- National Geospatial Mission
- Gyan Bharatam Mission: Conservation of 1 crore+ manuscripts.
Exports and Trade
- Export Promotion Mission: With ministerial and sectoral targets.
- BharatTradeNet (BTN): Unified platform for trade finance and docs.
- GCC Framework: Promote Global Capability Centres in Tier-2 cities.
Financial Sector Reforms
- FDI in Insurance: Raised from 74% to 100% for domestic investment.
- NaBFID Credit Enhancement Facility: For infra bonds.
- Grameen Credit Score: For SHGs and rural borrowers.
- Investment Friendliness Index: To rank states in 2025.
- Jan Vishwas Bill 2.0: Decriminalization of 100+ provisions.
- Tonnage Tax Extended: To inland vessels.
- Startups: Tax benefit eligibility extended to incorporation by 1 April 2030.
Taxation Reforms
Direct Taxes
- No Personal Tax: Income up to ?12 lakh (?12.75 lakh for salaried) under new regime.
- Revised Tax Slabs (New Regime):
- 0–4L: Nil | 4–8L: 5% | 8–12L: 10%
- 12–16L: 15% | 16–20L: 20% | 20–24L: 25% | 24L+: 30%
- Standard Deduction: ?75,000
- Compliance Relief: Trusts registration extended to 10 years.
- TDS/TCS Rationalization: Fewer thresholds, higher limits for senior citizens and rent.
- Tax Certainty: Safe harbour rules, startup extensions, presumptive taxation for electronics.
Indirect Taxes
- Tariff Rationalization: Only 8 remaining tariff rates.
- Customs Relief: ?2,600 crore forgone, key lifeline drugs exempted.
- Support to Domestic Manufacturing:
- EV/mobile battery manufacturing: 63 capital goods exempted
- Ships: BCD exemption extended for 10 years
- Marine, leather, textiles: Several BCD reductions/exemptions
- Voluntary Compliance Scheme: Without penalty for post-clearance corrections.
Geo-Economic Fragmentation (GEF)

- 02 Feb 2025
In News:
Geo-economic fragmentation refers to a policy-driven reversal of global economic integration, increasingly shaped by geopolitical alignments. It signifies a shift from globalization to strategically-driven economic blocs, where nations prioritize political alliances over market efficiency.
Key Characteristics
- Emergence of friend-shoring, re-shoring, and economic nationalism.
- Fragmentation of trade, capital flows, FDI, and migration.
- Retreat from multilateralism, with institutions like the WTO and IMF under stress.
- Strategic use of environmental, labor, and social standards by developed countries to impose uniform regulations, causing tensions.
Globalization to Fragmentation: Statistical Evidence
- Trade-to-GDP Ratio: Increased from 39% (1980) to 60% (2012); now threatened by rising protectionism.
- FDI Inflows: Rose from $54 billion (1980) to $1.5 trillion (2019); now increasingly concentrated among like-minded countries.
- Global Economy: Expanded from $11 trillion (1980) to over $100 trillion (2022).
- Trade Restrictions (WTO Report):
- 2023–24: 169 new measures covering $887.7 billion in trade.
- 2022–23: Covered $337.1 billion — shows a dramatic rise in protectionism.
- Over 24,000 new trade and investment restrictions imposed globally between 2020–24.
IMF on Costs of GEF
- Trade fragmentation could cause 0.2% to 7% GDP losses, especially for developing countries.
- Current fragmentation is more costly than Cold War era, as trade now constitutes 45% of global GDP (vs. 16% then).
- Less trade = less knowledge diffusion, innovation, and productivity gains.
Strategic Impacts: Global Supply Chains
China’s Dominance
- 80% of global battery manufacturing.
- 80% of solar panel components.
- 60% of wind turbine capacity.
- 70% of global rare earth mineral processing.
- Dominates EV supply chains, critical mineral refining, and clean energy manufacturing.
FDI Realignment
- FDI is increasingly relocating from China to India, Vietnam, Mexico, etc.
- Friend-shoring reduces capital access for emerging markets.
- Emerging economies face reduced FDI, slower growth, and technological decoupling.
India’s Strategic Response: Deregulation and Internal Growth
Policy Recommendations (Economic Survey 2024–25)
- Amplify deregulation to lower compliance costs and boost entrepreneurship.
- Empower SMEs to withstand global shocks and strengthen domestic manufacturing.
- Encourage inter-state learning for best practices in economic governance.
- Redouble efforts to boost exports and foreign investment amidst global volatility.
Rationale
- With the decline of global cooperation, internal engines of growth become crucial.
- Deregulation can unleash innovation, enhance productivity, and ensure resilient growth.
- India's response must be strategic, systematic, and state-inclusive to capitalize on this global transition.
Economic Survey 2024–25
- 01 Feb 2025
In News:
- Released on 31st January 2025, a day before the Union Budget.
- Prepared by the Department of Economic Affairs, Ministry of Finance.
- Provides a comprehensive review of India’s macroeconomic trends, sectoral developments, and key policy challenges.
- Real GDP growth estimated at 6.4% in FY25 (close to decadal average); projected between 6.3–6.8% in FY26.
- Reflects India's resilience amidst global slowdown, supply chain disruptions, and geopolitical uncertainties.
Sector-wise Performance
Agriculture:
- Expected growth: 3.8% in FY25.
- Record Kharif foodgrain production: 1647.05 LMT (+5.7% YoY).
- Growth driven by horticulture, livestock, and fisheries.
- Supported by above-normal monsoons and robust reservoir levels.
Industry:
- Estimated growth: 6.2% in FY25.
- Construction, utilities, and mining contribute significantly.
- Challenges: Sluggish export demand, climate disruptions, and festival timing variations.
- Manufacturing PMI remains in the expansionary zone.
Services:
- Robust growth: 7.2% in FY25.
- Services exports up by 12.8% (April–Nov FY25) vs 5.7% in FY24.
- Growth led by finance, real estate, public administration, and professional services.
Inflation and Price Stability
- Retail inflation eased to 4.9% (Apr–Dec 2024) from 5.4% (FY24).
- Food inflation remains high at 8.4%, driven by pulses and vegetables.
- CPI expected to align with RBI's 4% target by FY26.
Investment and Infrastructure
- Capital Expenditure grew 8.2% YoY (Jul–Nov 2024); sustained increase since FY21.
- Infrastructure momentum:
- 2031 km railways commissioned (Apr–Nov 2024).
- 17 Vande Bharat trains introduced.
- Port efficiency improved; container turnaround time reduced from 48.1 to 30.4 hours.
- Renewable energy capacity rose by 15.8% YoY (Dec 2024).
External Sector and Trade
- Overall exports grew by 6% (Apr–Dec 2024); merchandise exports up 1.6%.
- Services exports surged; India now 7th largest globally.
- FDI inflows: $55.6 billion (Apr–Nov FY25), +17.9% YoY.
- Forex reserves at $640.3 billion (Dec 2024), covering 10.9 months of imports and 90% of external debt.
- CAD contained at 1.2% of GDP in Q2 FY25.
- Strong remittance inflows support BOP stability.
Fiscal Health
- Gross Tax Revenue rose 10.7% YoY (Apr–Nov 2024).
- Stable deficit indicators allowed for developmental expenditure.
- State revenue expenditure grew 12%, with subsidies increasing by 25.7%.
Banking, Credit, and Financial Markets
- Gross NPAs dropped to 2.6% (lowest in 12 years).
- CRAR of scheduled banks at 16.7% (Sept 2024), well above regulatory norms.
- Stock market cap to GDP ratio: 136%, higher than China (65%) and Brazil (37%).
- Credit-GDP gap reduced to -0.3% in Q1 FY25 (from -10.3% in Q1 FY23).
Employment and Labour Market
- Unemployment rate declined to 3.2% (2023-24) from 6.0% (2017-18).
- Labour Force Participation Rate (LFPR) and Worker-Population Ratio (WPR) improved.
- Emphasis on AI skill development to future-proof labour markets.
Health, Education & Social Sector
- Government health expenditure rose from 29% to 48% of total health spending (FY15–FY22).
- Out-of-pocket expenditure dropped from 62.6% to 39.4% in the same period.
- Education reforms aligned with NEP 2020 via programs like Samagra Shiksha, DIKSHA, PM SHRI, etc.
- Social services spending grew at 15% CAGR (FY21–FY25).
- Decline in Gini coefficient indicates improving consumption equality.
Policy Recommendations and Reform Agenda
- Deregulation as central theme to boost productivity and EoDB.
- Advocates Ease of Doing Business 2.0, led by states, targeting:
- Simplification of compliance norms.
- Risk-based regulation.
- Reduction in tariffs and licensing hurdles.
- ?50,000 crore Self-Reliant India Fund launched for MSME equity support.
- Need for long-term infrastructure investment to achieve Viksit Bharat@2047.
Global Backdrop
- Global GDP grew by 3.3% in 2023, with an average 3.2% growth projected over next five years (IMF).
- Weak global manufacturing; services sector remains stronger.
- Risks: Geopolitical tensions, trade policy fragmentation, energy transition dependence on China.
Way Forward
- Balanced outlook for FY26 with upside from:
- Strong rural demand.
- Agricultural recovery.
- Easing food inflation.
- Challenges include:
- Geopolitical tensions.
- Global trade and commodity price volatility.
- Delay in private investment materialisation.
Addressing Environmental Challenges and Strengthening Regulations in India
- 28 Jan 2025
In News:
India's recent coal mining tragedy in Dima Hasao, Assam, underscores the nation's ongoing struggle with illegal and hazardous rat-hole mining, despite the National Green Tribunal's 2014 ban. This persistent exploitation, driven by industrial demand for coal, highlights the gap between environmental regulations and their enforcement, revealing a broader issue of balancing economic growth with environmental protection. As India strives to meet ambitious climate goals and sustain economic development, strengthening environmental regulations becomes critical.
Current Environmental Regulations in India
India has established a strong legal framework to protect its environment, grounded in the Indian Constitution. Articles 48A and 51A(g) direct the state and citizens to safeguard the environment, while Article 21 ensures the right to a clean and healthy environment, as interpreted by the Supreme Court. Key pollution control laws include:
- Water (Prevention and Control of Pollution) Act, 1974: Regulates water pollution and establishes pollution control boards at the national and state levels.
- Air (Prevention and Control of Pollution) Act, 1981: Controls air pollution from industrial emissions and vehicles.
- Environment (Protection) Act, 1986: Provides overarching powers for environmental protection.
- Plastic Waste Management Rules, 2016: Regulates plastic waste disposal and bans single-use plastics.
Other significant laws focus on forest and wildlife protection, including the Indian Forest Act, 1927, and the Wildlife (Protection) Act, 1972, along with the National Green Tribunal (NGT) Act, 2010, which ensures quick resolution of environmental disputes.
Key Issues with Enforcement
- Despite these stringent regulations, enforcement remains weak due to institutional limitations. Many industrial units fail to meet environmental standards, with regulatory bodies underfunded and understaffed. For example, pollution control boards in states like Uttar Pradesh and Bihar are plagued by staffing shortages, hampering their ability to monitor pollution effectively.
- Inadequate public participation and insufficient technology adoption further exacerbate these challenges.
- The Environmental Impact Assessment (EIA) process, often bypassed or diluted, leads to development projects being approved without full consideration of their environmental impacts, particularly in ecologically sensitive areas.
Weak Enforcement and Conflict between Development and Conservation
The tension between development and conservation is evident in policies that relax environmental regulations for economic growth. The Forest (Conservation) Amendment Act, 2023, prioritizes infrastructure projects over forest preservation, undermining ecological conservation. Moreover, the rapid urbanization of cities like Gurugram and Faridabad has led to large-scale deforestation and a reduction in natural conservation zones, worsening air and water quality.
Strengthening Environmental Regulations
To address these challenges, India needs to strengthen its environmental regulatory mechanisms:
- Enhance Enforcement: Adequate funding, skilled personnel, and advanced technology, such as AI-based pollution monitoring and drone surveillance, are essential to improve compliance.
- EIA Reforms: The EIA process should be made more transparent and participatory, ensuring that marginalized communities are included in decision-making.
- Promote Clean Energy: Expanding subsidies for renewable energy and encouraging industries to adopt green technologies will help reduce reliance on fossil fuels.
- Circular Economy: Encouraging industries to adopt recycling and upcycling practices can minimize waste and reduce resource extraction.
- Strengthen Local Involvement: Empowering local communities through decentralization under the Forest Rights Act will ensure more inclusive environmental governance.
Conclusion
India’s environmental challenges require a balanced approach, integrating sustainable development with robust environmental protections. Strengthening regulatory enforcement, reforming the EIA process, and fostering community-led conservation are essential to aligning economic growth with environmental sustainability. By addressing these gaps, India can better navigate its path toward achieving both its development goals and climate commitments.
External Commercial Borrowings (ECBs)
- 25 Jan 2025
In News:
A recent State Bank of India (SBI) report highlights the evolving trends in investment activity and the increasing importance of External Commercial Borrowings (ECBs) in financing India's economic growth. It also reflects rising private sector participation and a robust capital formation trend.
Investment Trends in India:
- Total Investment Announcements reached ?32.01 lakh crore during April–December 2024 (9MFY25), up 39% from the same period in FY24.
- The private sector accounted for 70% of investments in 9MFY25, up from 56% in FY24, indicating rising business confidence.
- Gross block of Indian corporates rose to ?106.5 lakh crore (March 2024), from ?73.94 lakh crore in March 2020—an addition of over ?8 lakh crore annually.
- Capital Work in Progress stood at ?13.63 lakh crore, reflecting ongoing infrastructure and industrial projects.
- Household Net Financial Savings (HNFS) improved to 5.3% of GDP in FY24 from 5.0% in FY23.
- Investment-to-GDP ratio improved, with:
- Government investment at 4.1% of GDP (FY23) — highest since FY12.
- Private corporate investment rising to 11.9% in FY23, projected to reach 12.5% in FY24.
What are External Commercial Borrowings (ECBs)?
ECBs refer to loans raised by Indian entities from foreign lenders, including commercial banks, export credit agencies, and institutional investors. These borrowings are regulated by the Reserve Bank of India (RBI) and used for purposes like capital expansion, modernization, and infrastructure development.
Current Status of ECBs (as of Sept–Nov 2024):
- Outstanding ECBs stood at $190.4 billion (Sept 2024).
- Private sector share: 63% (~$97.6 billion).
- Public sector share: 37% (~$55.5 billion).
- Of the total, non-Rupee and non-FDI ECBs accounted for $154.9 billion.
- ECBs registered (April–Nov 2024): $33.8 billion, mainly for capital goods import, local capex, and new projects.
- Cost of ECBs declined to:
- 6.6% average during April–November 2024.
- 5.8% in November 2024, down by 71 basis points from the previous month.
- Hedging practices: Private companies hedge about 74% of their ECB exposure, essential for managing currency risk.
Why Are ECBs Important for India?
- Bridging Capital Gaps: Domestic markets may not meet the capital needs of large projects.
- Lower Interest Rates: ECBs often offer cheaper financing than domestic loans.
- Infrastructure Financing: Key source of funds for sectors needing long-term investment.
- Foreign Exchange Access: Supports imports, modernization, and technology adoption.
- Private Sector Expansion: Enables firms to grow, diversify, and remain globally competitive.
Challenges and Risks:
- Currency Risk: Rupee depreciation can raise repayment costs.
- Interest Rate Risk: Linked to global rates (e.g., LIBOR/SOFR), which can rise unpredictably.
- Hedging Costs: Though necessary, hedging adds to borrowing costs.
- Global Dependency: Exposure to international financial volatility.
- Regulatory Constraints: RBI norms on end-use, maturity, and cost ceilings can reduce flexibility.
- Over-Borrowing Risk: Mismanagement can lead to unsustainable debt levels and strain forex reserves.
Clarification on ECB Liability Data:
- Some media reports mistakenly cited India’s ECB stock as $273 billion.
- The actual ECBs, as per RBI (Sept 2024), stand at $190.4 billion.
- The inflated figure includes $72 billion in FPI (Debt), which should not be classified as ECBs.
Way Forward:
- Regulatory Refinement: Simplify ECB rules for strategic sectors and long-term projects.
- Encourage Hedging: Make risk management more affordable and accessible.
- Prudent Borrowing: Promote ECBs for infrastructure, exports, and modernization rather than working capital.
- Monitoring and Oversight: Ensure transparency and prevent over-leverage.
- Strengthen Domestic Financing: To reduce overdependence on foreign borrowing.
India’s Renewable Energy Revolution
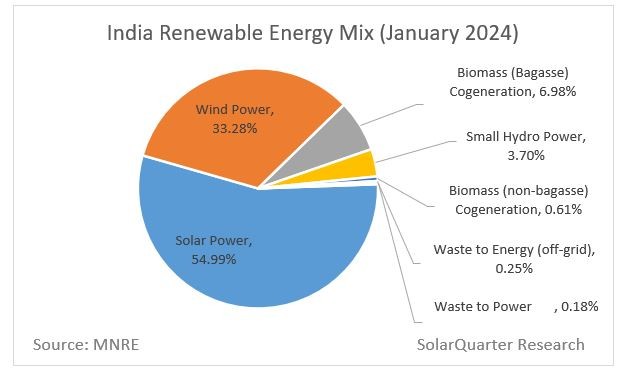
- 22 Jan 2025
Introduction
India's transition towards clean energy has accelerated, with 2024 witnessing record-breaking renewable energy (RE) installations and policy innovation. With a vision to achieve 500 GW of non-fossil fuel capacity by 2030 and net-zero emissions by 2070, India is shaping itself as a global leader in sustainable development.
What is Renewable Energy?
Renewable energy is derived from naturally replenishing sources like solar, wind, hydropower, and biomass. It plays a vital role in:
- Reducing dependence on fossil fuels.
- Lowering greenhouse gas emissions.
- Ensuring long-term energy security.
India’s RE Targets and Progress
Parameter Target/Status
2030 Target 500 GW of non-fossil fuel capacity
Net Zero by 2070
Current Status (Jan 2025) 217.62 GW of non-fossil fuel-based capacity
Short-term Goal 50% energy capacity from renewable sources
2024: Year of Renewable Milestones
Solar Energy
- 24.5 GW added in 2024 — a 2.8x increase over 2023.
- 18.5 GW utility-scale solar: Rajasthan, Gujarat, Tamil Nadu contributed 71%.
- Rooftop Solar:
- 4.59 GW added (↑53%)
- 7 lakh installations under PM Surya Ghar: Muft Bijli Yojana.
- Off-grid Solar:
- 1.48 GW added (↑182%), promoting rural energy access.
Wind Energy
- 3.4 GW added: Gujarat (1,250 MW), Karnataka (1,135 MW), Tamil Nadu (980 MW) = 98% of new capacity.
Hydropower & Others
- Existing hydropower plants modernized to improve efficiency.
Government Initiatives Driving Growth
Scheme/Initiative Purpose
PM Surya Ghar: Muft Bijli Yojana Rooftop solar subsidies for households
Green Energy Corridor (GEC) Transmission infra for RE-rich states
Hydrogen Energy Mission Promote green hydrogen production
National Smart Grid Mission (NSGM) Integration of variable RE sources into the grid
FAME Scheme Promote EV adoption, indirectly supporting RE usage
International Solar Alliance (ISA) Strengthen global cooperation in solar energy
Challenges in RE Expansion
- Land Acquisition: Resistance from locals, especially in solar park areas.
- Grid Stability: Intermittency of solar/wind leads to voltage and frequency issues.
- Storage Gaps: Lack of large-scale battery storage limits surplus utilization.
- E-Waste Concerns: Rising disposal of solar panels and batteries.
- Mineral Dependency: Import reliance on lithium, cobalt, etc.
- Regulatory Bottlenecks: Delay in approvals and lack of inter-state coordination.
Way Forward: Strategic Interventions
Technological Innovation
- Floating Solar Projects: Utilize reservoirs to save land and reduce evaporation.
- Decentralized Systems: Peer-to-peer trading via blockchain for energy democratization.
- Green Hydrogen: Use surplus RE for hydrogen fuel, develop hydrogen corridors.
Infrastructure & Manufacturing
- Renewable Energy SEZs: Promote local manufacturing and innovation.
- Smart Grid Development: Improve grid flexibility and real-time balancing.
Environmental Management
- Circular Economy for RE Waste: Design policies for solar panel and battery recycling.
- Urban Integration: Incentivize rooftop installations in urban centers.
Conclusion
India’s renewable energy revolution is at a crucial juncture. With 2024 setting a strong precedent through record installations and policy progress, the path to 2030 and beyond will require addressing infrastructural, financial, and regulatory challenges. A multi-pronged, inclusive, and technology-driven approach will help India lead the global clean energy transition.
Satellite Docking Experiment (SpaDeX)
- 17 Jan 2025
In News:
The Indian Space Research Organisation (ISRO) achieved a historic milestone by successfully executing a satellite docking experiment, making India the fourth country after the United States, Russia, and China to accomplish this feat. This advancement represents a significant leap in India's space capabilities, positioning the nation at the forefront of space exploration and in-orbit servicing.
Key Highlights:
- The Space Docking Experiment (SpaDeX) is a critical technological demonstration by ISRO aimed at developing autonomous docking and undocking capabilities in space.
- The mission involves two satellites, SDX01 (Chaser) and SDX02 (Target), which were launched aboard PSLV C60 on December 30, 2024.
- The docking maneuver was overseen by the Mission Operations Complex (MOX) at the ISRO Telemetry, Tracking, and Command Network (ISTRAC) and was successfully completed in the early hours of January 18, 2025.
Key Steps in the Docking Process:
- Manoeuvre from 15m to 3m hold point.
- Precision docking initiation, leading to spacecraft capture.
- Retraction and rigidization for stability.
- Successful control of the docked satellites as a single object.
Significance of the Mission
- Technological Advancement: The docking of two spacecraft in orbit is a crucial capability that paves the way for:
- Autonomous spacecraft operations
- Refueling and maintenance of satellites
- Space station development
- Lunar and interplanetary missions
Future Applications
- Manned Missions: Enables India to develop technology for manned lunar missions and future space station operations.
- Satellite Servicing: Allows repair, maintenance, and extension of satellite lifespan, reducing costs and space debris.
- Sample Return Missions: Essential for lunar and planetary sample retrieval, crucial for deep-space exploration.
Challenges and Overcoming Setbacks
The SpaDeX docking was initially scheduled for January 7, 2025, but was postponed due to the need for further ground validation and an unexpected drift between the satellites. The issue was later resolved, and the docking was executed with precision.
The Road Ahead
Undocking and Power Transfer Demonstration
- ISRO will follow up with power transfer checks between the docked satellites.
- The satellites will later undock and operate separately for the remaining mission duration of up to two years.
Expanding Space Capabilities
- The successful execution of SpaDeX aligns with India’s plans for an independent space station by the 2030s.
- Strengthens India’s position in international space collaborations and commercial space services.
Conclusion
The SpaDeX mission represents a landmark achievement for India’s space program, placing it among the elite nations capable of satellite docking. This breakthrough will serve as a foundation for India’s ambitious future missions, including deep-space exploration, human spaceflight, and interplanetary research. As ISRO continues to develop advanced space technologies, India is set to play a crucial role in the future of global space exploration.
Genome India Project

- 14 Jan 2025
In News:
The Genome India Project is an ambitious national initiative aimed at decoding the genetic diversity of India’s population. Launched in January 2020 by the Department of Biotechnology (DBT), the project seeks to create a comprehensive map of India’s genetic variations, offering insights that can revolutionize public health, medicine, and our understanding of human genetics.
What is Genome Sequencing?
Genome sequencing is the process of determining the complete DNA sequence of an organism’s genome. The human genome, composed of about 3 billion base pairs of DNA, contains all the genetic instructions necessary for the growth, development, and functioning of the human body. The process involves extracting DNA from a sample (often blood), breaking it into smaller fragments, and using a sequencer to decode these fragments. The data is then reassembled to reconstruct the full genome.
Key Aims and Objectives
The Genome India Project aims to address several crucial scientific and healthcare challenges:
- Create an Exhaustive Catalog of Genetic Variations: This includes common, low-frequency, rare, and structural variations (such as Single Nucleotide Polymorphisms or SNPs).
- Establish a Reference Haplotype Structure: This reference panel will be used for imputing missing genetic variations in future genetic studies.
- Design Affordable Genome-wide Arrays: These arrays will be useful for research and diagnostics at a lower cost, making genetic analysis accessible.
- Create a Biobank for Future Research: The collected DNA and plasma will be preserved for future studies to facilitate ongoing genetic research.
Genome India Project: Phase 1 and Key Findings
The project’s Phase 1 focused on sequencing the genomes of 10,074 individuals from 99 ethnic groups across India. This initiative provides a critical baseline for studying the country’s genetic diversity. Some of the key findings include:
- 459 plant species have been identified as part of genetic diversity studies.
- 135 million genetic variations have been uncovered, including 7 million that are unique to India, not found in global databases.
- The project has revealed several genetic risks specific to Indian populations, such as the MYBPC3 mutation (linked to cardiac arrest) and the LAMB3 mutation (associated with a lethal skin condition), which are not commonly seen in global datasets.
This database will serve as a vital resource for researchers, contributing to the development of precision medicine, better disease diagnosis, and more personalized treatments.
Second Phase: Expanding the Scope
The second phase of the Genome India Project will focus on sequencing the genomes of individuals suffering from specific diseases. This will enable researchers to:
- Compare the genomes of healthy individuals with those having diseases, helping identify genetic mutations responsible for conditions like cancer, diabetes, and neurodegenerative diseases.
- Investigate rare diseases specific to Indian populations and develop therapies tailored to these conditions.
By sequencing the genomes of individuals with various conditions, the project aims to pinpoint genetic factors that contribute to the pre-disposition or causation of diseases.
Data Sharing and Security
To ensure data security and privacy, the genetic information will be made available only through managed access. Researchers interested in using the data will need to submit a proposal and collaborate with the Department of Biotechnology. The data will be stored securely at the Indian Biological Data Centre (IBDC) in Faridabad, Haryana, and anonymized to maintain confidentiality.
Why Does India Need Its Own Genetic Database?
India is home to a highly diverse population, with over 4,600 distinct ethnic groups and varying genetic backgrounds. The country’s genetic diversity, shaped by its geographical, cultural, and historical context, cannot be fully understood through datasets derived from other countries. The Genome India Project helps:
- Identify Genetic Risk Factors: For various diseases, paving the way for developing targeted diagnostic tools and therapies.
- Uncover Unique Variants: Some genetic mutations found in India, such as the Vaishya community’s resistance to anaesthetics, are absent in global databases.
- Address Population-specific Health Issues: Genetic mapping enables the identification of prevalent diseases and health conditions specific to Indian populations.
Global Context and Comparison
India’s genome sequencing effort is part of a larger global movement in genomics:
- Human Genome Project (2003): The first international effort to decode the human genome.
- 1,000 Genome Project (2012): Published 1,092 human genome sequences.
- UK 100,000 Genome Project (2018): Sequenced 100,000 genomes for health research.
- European Genome Project: Aims to sequence over 1 million genomes across 24 countries.
The Genome India Project fills a crucial gap by focusing on the genetic diversity of Indian populations, which differs significantly from the genetic profiles studied in Western or European genomes.
Applications of Genome India Project
The Genome India Project has the potential to impact multiple areas:
- Advancements in Medicine: Understanding genetic variations can lead to the development of personalized medicine, where treatments are tailored to individual genetic profiles.
- Genetic and Infectious Disease Control: The project helps identify genetic resistance to diseases, and aids in understanding how certain populations may respond differently to drugs or vaccines.
- Public Health Policies: Data from the project can inform health policies, especially in tackling diseases prevalent in specific regions or communities.
- International Research Collaboration: The project aims to foster collaboration with global research communities, enhancing India’s presence in the field of genomics.
Conclusion:
The Genome India Project is a landmark initiative for India’s scientific community, enabling better understanding of the country’s genetic diversity and paving the way for breakthroughs in medicine, healthcare, and disease prevention. The ability to analyze genetic variations on such a large scale provides immense opportunities for precision medicine and personalized treatments.
Rat-hole mining
- 13 Jan 2025
In News:
In Dima Hasao district of Assam, at least nine workers aged between 26 and 57 were trapped in a coal “rat-hole” mine after it was flooded with water. Three miners trapped in a flooded coal mine were confirmed dead, while six remained stuck. Later an Indian Navy team, including deep-sea divers, arrived at the site, where the water level inside the pit is 200 feet deep.
Key Takeaways:
- Rat-hole mining is a method of extracting coal from narrow, horizontal seams, prevalent in Meghalaya. The term “rat hole” refers to the narrow pits dug into the ground, typically just large enough for one person to descend and extract coal.
- Once the pits are dug, miners descend using ropes or bamboo ladders to reach the coal seams. The coal is then manually extracted using primitive tools such as pickaxes, shovels, and baskets.
- Types of Rat-hole mining:
- Side-cutting mining: In the side-cutting procedure, narrow tunnels are dug on the hill slopes and workers go inside until they find the coal seam. The coal seam in the hills of Meghalaya is very thin, less than 2 m in most cases.
- Box-cutting mining: In the other type of rat-hole mining, called box-cutting, a rectangular opening is made, varying from 10 to 100 sqm, and through that a vertical pit is dug, 100 to 400 feet deep. Once the coal seam is found, rat-hole-sized tunnels are dug horizontally through which workers can extract the coal.
- Concerns associated with Rat-hole mining: Rat-hole mining poses significant environmental and safety hazards. This method of mining has faced severe criticism due to its hazardous working conditions, and numerous accidents leading to injuries and fatalities.
- The mines are typically unregulated, lacking safety measures such as proper ventilation, structural support, or safety gear for the workers. Additionally, the mining process can cause land degradation, deforestation, and water pollution. Despite attempts by authorities to regulate or ban such practices, they often persist due to economic factors and the absence of viable alternative livelihoods for the local population.
- Notably, the National Green Tribunal (NGT) banned Rat-hole mining in 2014, and retained the ban in 2015, on grounds of it being unscientific and unsafe for workers. The order was in connection with Meghalaya, where this remained a prevalent procedure for coal mining. The state government then appealed the order in the Supreme Court.
Role of Rat-Hole Mining in Uttarkashi Tunnel Rescue
- The rat-hole mining practice, banned for being unsafe, helped in the rescue operation of 41 workers trapped in the collapsed Silkyara-Barkot tunnel in Uttarakhand in 2023.
- Rat-hole miners were called in after the auger machine that was drilling through the debris broke. Rescuers then tried cutting through the blade stuck inside the rescue pipes and removing it piece by piece. As large metal pieces hindered the machine drilling, the rescuers went ahead with rat-hole mining.
- It was a test of grit and perseverance – for men on both sides of the 57 metres of debris – as the rescue operation suffered one setback after another. In the end, it was miners who dug through the last 12 metres and reached the trapped men.
Why Farmers Deserve Price Security
- 11 Jan 2025
Introduction:
The future of Indian agriculture is at a crossroads. With the shrinking of the agricultural workforce and the diversion of fertile farmlands for urbanization, ensuring the sustainability of farming is a strategic imperative. Among the various support mechanisms for farmers, the Minimum Support Price (MSP) remains a central point of debate. Should there be a legal guarantee for MSP? This question has gained prominence, especially with the rising challenges in agriculture, from unpredictable climate patterns to volatile market prices.
The Decline of Agriculture and Its Impact
India’s agricultural sector faces a dual crisis: loss of both land and human resources. Prime agricultural lands across river basins, such as the Ganga-Yamuna Doab or the Krishna-Godavari delta, are being repurposed for real estate, infrastructure, and industrial projects. Additionally, the number of "serious farmers" – those deriving at least half of their income from agriculture – is dwindling. The number of operational holdings may be 146.5 million, but only a small fraction of these farmers remains committed to agriculture.
This decline threatens the future of India’s food security, as the country will need to feed a population of 1.7 billion by the 2060s. To sustain farming and ensure long-term food security, we must secure farmers' livelihoods. Price security, particularly through MSP, plays a crucial role in this context.
The Role of MSP in Securing Farmers
MSP is the government-mandated price at which it guarantees the purchase of crops if market prices fall below a certain threshold. It provides a safety net for farmers against price volatility. The process of fixing MSP involves recommendations by the Commission for Agricultural Costs and Prices (CACP), which takes into account factors such as the cost of production and market trends. Once approved by the Cabinet Committee on Economic Affairs (CCEA), MSP is set for various crops, including rice, wheat, and sugarcane.
For farmers to stay in business, there must be a balance between production costs and returns. Farming is a risky business – yield losses can occur due to weather anomalies, pest attacks, or other natural factors. However, price risks can be mitigated with a guaranteed MSP. This would encourage farmers to invest in their land and adopt modern farming technologies, which would boost productivity and reduce costs.
Arguments for and Against Legal MSP Guarantee
Supporters of a legal MSP guarantee argue that it would provide financial security to farmers, protecting them from unpredictable market conditions. It would also promote crop diversification, encourage farmers to shift from water-intensive crops to those less dependent on irrigation, and inject resources into rural economies, thus addressing distress in rural areas.
However, critics highlight several challenges with a legal guarantee for MSP. The most significant concern is the fiscal burden it would impose on the government, potentially reaching Rs. 5 trillion. Furthermore, such a system could distort market dynamics, discouraging private traders and leading to a situation where the government becomes the primary buyer of agricultural produce. This could be economically unsustainable, especially for crops with low yields. Additionally, legal MSP guarantees could violate World Trade Organization (WTO) subsidy principles, adversely impacting India’s agricultural exports.
The Way Forward: A Balanced Approach
Given the challenges associated with a legal MSP guarantee, alternative measures should be explored. Price Deficiency Payment (PDP) schemes, such as those implemented in Madhya Pradesh and Haryana, could be expanded at the national level. These schemes compensate farmers for the difference between market prices and MSP, ensuring price security without the fiscal burden of procurement.
Additionally, the government can focus on improving agricultural infrastructure, such as cold storage facilities, to help farmers better access markets and increase price realization. Supporting Farmer Producer Organizations (FPOs) could also help farmers by enhancing collective bargaining power and ensuring better prices for their produce. Moreover, gradual expansion of MSP coverage to include a wider range of crops would encourage diversification, reducing the dominance of rice and wheat.
River Interlinking: Environmental Disaster or Solution?
- 09 Jan 2025
Overview of the River Interlinking Concept
The concept of river interlinking in India traces its origins to the 19th century, when Sir Arthur Cotton first proposed inter-basin water transfer to address irrigation issues. Over time, this idea was refined by other experts. It evolved into the National Water Grid and, later, the River-Interlinking Project (ILR) under the Ministry of Water Resources. The goal is to transfer surplus water from rivers to drought-prone areas, aiming for water security, irrigation, and power generation.
Key Projects and Initiatives
- Ken-Betwa River Link Project (KBLP): Launched in December 2024, the KBLP will link the water-surplus Ken River with the drought-stricken Betwa River. It aims to irrigate over 10 lakh hectares, supply drinking water to 62 lakh people, and generate hydropower and solar power. However, concerns over the environmental impact of building a dam within the Panna Tiger Reserve have been raised.
- National River Linking Project (NRLP): The NRLP, formally known as the National Perspective Plan, is an ambitious proposal that includes 30 river links—14 Himalayan and 16 Peninsular—to connect India's rivers and create a giant South Asian Water Grid.
Benefits of Interlinking Rivers
- Flood and Drought Mitigation: Redistributing water from surplus areas to drought-prone regions, such as Bundelkhand, will reduce the severity of floods and droughts.
- Agriculture and Irrigation: Expanding irrigation systems across 35 million hectares of land could significantly boost agricultural productivity and food security.
- Hydropower Generation: The interlinking project has the potential to generate up to 34 GW of hydropower, contributing to India's renewable energy targets.
- Economic Growth: Improving water availability can boost industries, provide drinking water, and support economic development in underdeveloped regions.
- Inland Waterways: The project will also contribute to the expansion of inland waterways, benefiting trade and reducing transportation costs.
Challenges and Concerns
- Environmental Impact:
- Biodiversity Loss: Projects like the Ken-Betwa project raise alarms about the destruction of ecologically sensitive areas, such as the Panna Tiger Reserve.
- River Ecosystem Disruption: Altering natural river courses can harm aquatic life, disrupt deltaic ecosystems, and degrade water quality. For instance, the Sardar Sarovar Dam's impact on the Narmada river system shows the long-term consequences of such projects.
- Pollution: The mixing of cleaner and more polluted rivers could exacerbate water contamination issues.
- Social and Financial Costs:
- Displacement: Large-scale interlinking projects will displace millions, especially marginalized communities and indigenous people, and disturb local livelihoods.
- High Financial Burden: The total estimated cost of the NRLP is ?5.5 lakh crore, which does not include environmental rehabilitation costs or the long-term maintenance of the infrastructure.
- Climate Change: Predictions suggest that climate change could affect river flows and the availability of surplus water. This might render the interlinking project ineffective in the long term.
- Inter-State Conflicts: Water-sharing disputes, like the long-standing issues over the Cauvery and Krishna rivers, could intensify with more interlinking projects.
- Infrastructural Challenges: Maintaining vast canal networks and reservoirs, managing sedimentation, and acquiring land for construction are logistical hurdles.
Alternative Approaches and Solutions
- Efficient Water Management:
- Integrated Watershed Management: Implementing a comprehensive approach to manage existing water resources can reduce the need for large-scale river transfers.
- Groundwater Recharge: Focusing on efficient groundwater management by identifying recharge mechanisms and regulating water use is crucial for sustainability.
- Modern Irrigation Techniques:
- Drip Irrigation: Israel’s success with drip irrigation, which reduces water use by 25%-75%, provides an example of how modern technologies can save significant amounts of water.
- Virtual Water: Emphasizing the import of water-intensive goods (like wheat) could save local water resources, which would otherwise be used for domestic agriculture.
- National Waterways Project (NWP): An alternative to the interlinking project, NWP aims to improve water management by creating navigation channels that double as water distribution networks with a fraction of the land use.
Way Forward
- Comprehensive Impact Assessments: The need for multidisciplinary studies to evaluate the environmental, social, and economic impacts of river interlinking projects cannot be overstated. Stakeholder engagement is crucial for equitable decision-making.
- Sustainable Water Policies: A national water policy should prioritize sustainable water practices, focusing on local solutions, such as water harvesting, watershed management, and smart irrigation.
- Focus on Regional Solutions: Smaller, state-specific projects should be prioritized to address water scarcity issues without triggering large-scale environmental degradation.
The Impact of Climate Change on Earth’s Water Cycle
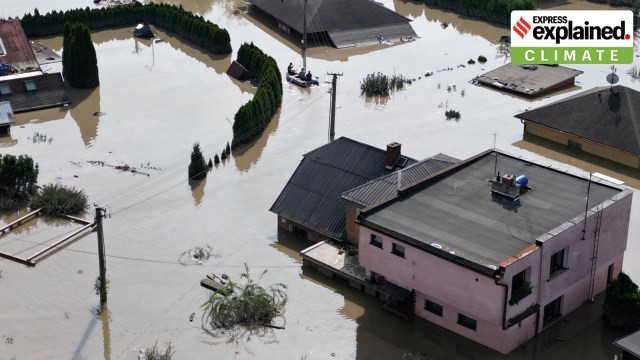
- 08 Jan 2025
In News:
Climate change is significantly affecting Earth's water cycle, leading to extreme weather events such as intense floods and prolonged droughts. According to the 2024 Global Water Monitor Report, this disruption is increasingly evident, as seen in the devastating weather patterns experienced worldwide in 2024. The report, based on data from international researchers, highlights how these changes are directly linked to rising global temperatures and the resulting shifts in precipitation patterns.
Understanding the Water Cycle
The water cycle is the continuous movement of water in various forms—solid, liquid, and gas—throughout the Earth's atmosphere, land, and bodies of water. This cycle involves processes such as:
- Evaporation: Water from the surface of oceans, lakes, and rivers turns into vapor.
- Transpiration: Water is absorbed by plants from the soil and released as vapor.
- Precipitation: Water vapor condenses into clouds and falls as rain or snow, replenishing the Earth's surface.
- Runoff and Infiltration: Precipitation either flows into rivers or infiltrates the soil, contributing to groundwater.
The water cycle is vital for maintaining the planet’s ecosystems, regulating weather patterns, and providing water for all living organisms. However, climate change is intensifying these natural processes, with far-reaching consequences.
Impact of Climate Change on the Water Cycle
As global temperatures rise, climate change is having a profound impact on the water cycle. Warmer temperatures lead to:
- Increased evaporation: As air temperatures soar, more water evaporates into the atmosphere. For every 1°C rise in temperature, the atmosphere can hold about 7% more moisture, which exacerbates storms and increases the intensity of rainfall.
- More intense precipitation: With more moisture in the atmosphere, storms have become more intense, leading to severe flooding in various regions.
- Increased droughts: Warmer air also dries out the soil. This reduces the amount of water available for crops and plants, while also increasing the evaporation rate from soil, leading to longer and more intense droughts.
This disruption of the water cycle is already causing erratic weather patterns, as some regions face severe droughts, while others are experiencing extreme rainfall and floods.
Key Findings from the 2024 Global Water Monitor Report
The 2024 report presents several alarming statistics that highlight the growing impact of climate change on the water cycle:
- Water-related disasters: In 2024, these disasters caused over 8,700 fatalities, displaced 40 million people, and resulted in economic losses exceeding $550 billion globally.
- Dry months: There were 38% more record-dry months in 2024 than the baseline period (1995-2005), underlining the growing frequency of droughts.
- Intense rainfall: Record-breaking rainfall occurred 27% more frequently in 2024 compared to 2000, with daily rainfall records set 52% more often. This shows the growing intensity of precipitation events.
- Terrestrial water storage (TWS): Many dry regions faced ongoing low TWS levels, reflecting the scarcity of water in these areas, while some regions, such as parts of Africa, saw an increase in water storage.
- Future predictions: Droughts may worsen in regions like northern South America, southern Africa, and parts of Asia, while areas like the Sahel and Europe could experience increased flood risks in the coming years.
Conclusion
The findings of the 2024 report underscore the alarming impact of climate change on the global water cycle. As temperatures continue to rise, we can expect more frequent and severe weather events, including extreme flooding and devastating droughts. These changes will affect billions of people worldwide, highlighting the urgent need for action to mitigate climate change and adapt to its consequences. Addressing this challenge requires global cooperation to reduce emissions, enhance water management systems, and protect vulnerable regions from the intensifying effects of climate change.
Introduction to Dr. Manmohan Singh's Economic Reforms

- 31 Dec 2024
In News:
Dr. Manmohan Singh, a distinguished economist, played a crucial role in shaping India’s economic trajectory. His leadership, as Finance Minister (1991–96) and Prime Minister (2004–14), is particularly noted for the economic liberalization and reform policies that transformed India’s economy.
India’s Economic Crisis of 1991
- Economic Collapse: India faced a severe balance of payments crisis, with dwindling foreign reserves and rising inflation.
- Key Challenges: Fiscal deficit, industrial stagnation, and trade imbalances worsened by the collapse of the Soviet Union.
- Urgent Measures: Dr. Singh was appointed Finance Minister during this crisis and initiated bold reforms to stabilize and grow the economy.
Key Reforms in 1991
- Devaluation of the Rupee
- Aimed at making Indian exports competitive in global markets.
- Reduced import tariffs and liberalized foreign trade.
- Industrial Policy Reforms
- Abolition of Licence Raj: Deregulated the industrial sector, promoting private enterprises.
- Reduced state control and encouraged foreign investment, leading to industrial growth.
- Banking and Financial Reforms
- Reduced the statutory liquidity ratio (SLR) and cash reserve ratio (CRR).
- Allowed for more credit flow, fostering economic expansion and banking sector efficiency.
- Global Integration
- Introduced economic liberalization policies, integrating India with the global economy and attracting foreign investments.
Economic Growth and Social Welfare Initiatives
- Poverty Reduction: Reforms helped lift millions out of poverty by fostering job creation and industrial growth.
- Mahatma Gandhi National Rural Employment Guarantee Act (MGNREGA): Launched in 2005, providing 100 days of wage employment to rural households.
- Right to Information (RTI) and Right to Education (RTE)
- Empowered citizens by ensuring transparency and access to government information.
- RTE guaranteed free and compulsory education for children aged 6-14.
- Financial Inclusion: Aadhar project introduced to facilitate welfare delivery and financial inclusion.
Legacy of Economic Liberalization and Growth
- Economic Growth: Under his leadership, India’s GDP grew at an average rate of 8%, establishing India as one of the fastest-growing economies.
- Shift to a Market-Driven Economy: Reforms dismantled socialist controls, facilitating the rise of the private sector.
- Attracting Foreign Investment: Economic liberalization and policy reforms made India an attractive destination for foreign capital.
Leadership During Political and Economic Challenges
- Reluctant Prime Minister
- In 2004, Singh became Prime Minister despite initial reluctance, emerging as a unifying figure during coalition politics.
- His tenure saw India’s rise as a global economic power, particularly from 2004–2009.
- Challenges
- Singh’s second term was marred by allegations of corruption and policy paralysis, leading to criticism of his administration.
- However, his personal integrity remained intact, and he maintained focus on governance.
- Historic India-US Nuclear Deal (2008)
- The deal marked a significant shift in India’s foreign relations and energy policies, enabling civilian nuclear trade.
Conclusion
Dr. Manmohan Singh’s economic policies are central to India's modern economic framework. His vision transformed India from a closed, socialist economy to a vibrant, globalized economy, promoting inclusive growth and institutional reforms. Despite facing challenges and criticisms, his legacy remains a testament to strategic policymaking that continues to influence India’s economic landscape.
Surge in E-Waste Generation in India
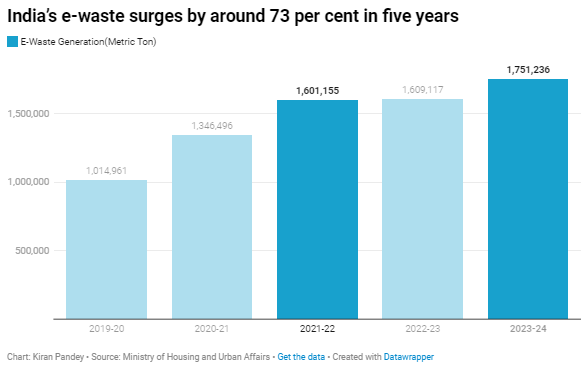
- 29 Dec 2024
In News:
India has seen a significant increase in electronic waste (e-waste) generation, rising by 72.54% from 1.01 million metric tonnes (MT) in 2019-20 to 1.751 million MT in 2023-24. The sharpest rise occurred between 2019-20 and 2020-21, driven by increased electronic consumption due to the COVID-19 pandemic's work-from-home and remote learning arrangements.
Environmental and Health Concerns
E-waste contains hazardous substances like arsenic, cadmium, lead, and mercury. If not properly managed, these materials can severely impact human health and the environment, contaminating soil and water sources.
Government Efforts: E-Waste Management Rules, 2022
- Introduction of Extended Producer Responsibility (EPR): The government introduced the E-Waste (Management) Rules, 2022, effective from April 1, 2023. These rules focus on making producers responsible for the recycling of e-waste. Producers are assigned recycling targets based on the quantity of e-waste generated or products sold and must purchase EPR certificates from authorized recyclers to meet these targets.
- Integration of Bulk Consumers: Public institutions and government offices, categorized as bulk consumers, are mandated to dispose of e-waste only through registered recyclers or refurbishers, ensuring proper treatment and recycling of the waste.
- Expansion of E-Waste Coverage: The updated rules expanded the scope to include 106 Electrical and Electronic Equipment (EEE) items from FY 2023-24, up from 21 items previously covered under the 2016 E-Waste Rules.
Challenges in E-Waste Recycling and Disposal
- Low Recycling Rates: Although the share of e-waste recycled in India has increased from 22% in 2019-20 to 43% in 2023-24, a significant 57% of e-waste remains unprocessed annually. Informal sector practices, which dominate e-waste handling, often lack the necessary environmental safeguards, leading to improper disposal and environmental contamination.
- Lack of Infrastructure and Awareness: India faces challenges in building adequate infrastructure for e-waste collection and recycling, resulting in improper disposal in landfills. Furthermore, a lack of public awareness regarding proper disposal methods exacerbates the problem.
Global Context and India’s Position
- India ranks as the third-largest e-waste generator globally, following China and the United States. With an increasing rate of e-waste generation, the country faces an urgent need to improve recycling efficiency and adopt sustainable disposal methods.
International and National Conventions on E-Waste
- India is a signatory to several international conventions that govern hazardous waste management, including the Basel Convention, which regulates the transboundary movement of hazardous wastes, and the Minamata Convention, which focuses on mercury. At the national level, India has established the E-Waste (Management) Rules, 2022, and other frameworks to manage and reduce e-waste effectively.
Strategic Recommendations for Effective E-Waste Management
- Harnessing the Informal Sector: India’s informal sector, which handles a significant portion of e-waste, must be integrated into the formal recycling systems. This can be achieved through training and financial support to ensure safe and environmentally responsible recycling practices.
- Technological Innovations: Encouraging research into advanced recycling technologies, such as AI and IoT-based solutions for efficient e-waste collection and tracking, will be crucial for improving the e-waste management system.
- Learning from Global Practices: Countries like the European Union (EU) and Japan have set strong examples. The EU’s Waste Electrical and Electronic Equipment (WEEE) Directive and Japan’s Home Appliance Recycling Law emphasize Extended Producer Responsibility (EPR) and provide models for India to adapt.
Conclusion
To address the growing e-waste challenge, India must improve its recycling infrastructure, integrate the informal sector, and adopt best practices from international models. With sustainable and effective strategies, India can mitigate the environmental and health risks posed by e-waste while promoting a circular economy.
Free Movement Regime
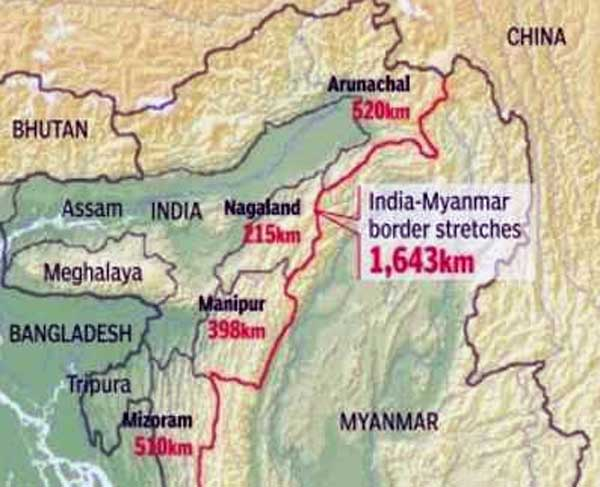
- 27 Dec 2024
In News:
The Indian government, through the Ministry of Home Affairs (MHA), has recently issued new guidelines to regulate the movement of people between India and Myanmar, especially along the border regions. These guidelines come after the suspension of the Free Movement Regime (FMR), which had previously allowed residents within a specified range of the border to move freely. The new protocol aims to enhance internal security and address concerns related to demographic shifts in India's northeastern states.
Background of the Free Movement Regime (FMR)
What is FMR?
The Free Movement Regime (FMR) is a bilateral arrangement between India and Myanmar that permits residents living in border areas to cross the international boundary without a visa. This agreement was established in 1968 to facilitate familial, cultural, and economic exchanges between people living on either side of the border.
Territorial Limits and Evolution
Initially, the FMR allowed free movement within a 40 km radius from the border. However, in 2004, this limit was reduced to 16 km, and additional regulations were introduced in 2016. The most recent development sees the limit further reduced to 10 km, with stricter regulations implemented to regulate the movement.
Recent Developments and New Guidelines
Suspension of FMR
In February 2023, Union Home Minister Amit Shah announced the suspension of the FMR along the India-Myanmar border, citing concerns about internal security and demographic changes, particularly in India's northeastern states. This decision came in the context of growing ethnic violence and political pressures, especially from states like Manipur.
Despite the announcement, the formal scrapping of the FMR is yet to be officially notified by the Ministry of External Affairs (MEA). However, the MHA has issued new guidelines to regulate cross-border movement, focusing on enhancing security without completely discontinuing the regime.
Key Features of the New Guidelines
The updated protocols issued by the MHA include several measures aimed at improving the security and regulation of movement across the border:
- Reduced Movement Limit: The new guidelines reduce the free movement limit from 16 km to 10 km from the border on both sides.
- Border Pass System: Residents wishing to cross into Myanmar or return to India must obtain a "border pass" from the Assam Rifles. This pass allows a stay of up to seven days in the neighboring country.
- Document and Health Checks: Upon entry into India, individuals will undergo a document inspection by the Assam Rifles, followed by security and health checks conducted by state police and health authorities. Biometrics and photographs will be collected, and a QR code-enabled border pass will be issued for verification.
- Designated Entry Points: There will be 43 designated entry and exit points across the border, with biometric verification and health screening required at all points.
- Monitoring and Enforcement: The Assam Rifles will oversee the movement, ensuring that individuals comply with the new regulations. Violations of the movement protocol will result in legal action.
Infrastructure and Technology Implementation
The government plans to establish infrastructure, such as biometric machines and software for border pass issuance. Pilot entry and exit points will be operational soon, with a phased implementation for the remaining points.
Political Reactions and Opposition
Regional Concerns and Opposition
The suspension of the FMR has been a contentious issue in India's northeastern states. The governments of Nagaland and Mizoram have raised objections to the scrapping of the regime, citing the cultural and familial ties of border communities. The Nagaland Assembly passed a resolution opposing the government's decision, while political leaders in Manipur argued that the unregulated movement of people had contributed to ethnic violence in the region.
Specific Concerns in Manipur
The chief minister of Manipur, N. Biren Singh, attributed ongoing ethnic conflicts in the state to the unchecked movement of people across the border. This was particularly evident in the violent ethnic clashes that broke out in 2023. As a result, Singh urged the Home Ministry to cancel the FMR along the India-Myanmar border, and the new guidelines reflect the state's concerns.
Conclusion
The suspension of the Free Movement Regime along the India-Myanmar border, followed by the introduction of stricter guidelines, marks a significant shift in India's border management policy. While the formal scrapping of FMR is yet to occur, the new protocols aim to balance security concerns with the region's long-standing cultural ties. The implementation of biometric checks and designated entry points signifies the government’s focus on modernizing border control while addressing regional concerns. The outcome of this policy shift will have important implications for internal security, demographic dynamics, and bilateral relations between India and Myanmar.
Bank Credit to Women Self-Help Groups (SHGs)
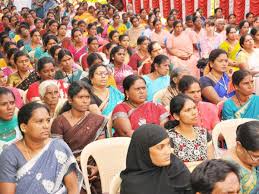
- 21 Dec 2024
Introduction
The Deendayal Antyodaya Yojana – National Rural Livelihoods Mission (DAY-NRLM) is a flagship program by the Ministry of Rural Development (MoRD) that aims to reduce poverty by empowering women, especially through Self-Help Groups (SHGs). These SHGs have been instrumental in improving financial inclusion, providing access to credit, and enhancing the economic and social status of women across India. The program has made significant strides in mobilizing women, improving their access to financial services, and facilitating entrepreneurial ventures in rural areas.
Key Features and Initiatives of DAY-NRLM
- Self-Help Groups (SHGs):
- Formation: DAY-NRLM supports the creation and strengthening of SHGs, primarily focusing on rural women from economically disadvantaged backgrounds.
- Mobilization: As of 2024, over 10.05 crore women have been mobilized into 90.87 lakh SHGs across India.
- Objective: The main goal is to reduce poverty through empowerment by providing access to financial services and sustainable livelihoods.
- Start-up Village Entrepreneurship Programme (SVEP):
- Support for Rural Enterprises: SVEP, a sub-scheme under DAY-NRLM, encourages SHG women and their families to set up small-scale businesses.
- Impact: As of October 2024, 3.13 lakh rural enterprises have been supported under this initiative.
- State-wise Distribution: The program has supported enterprises across various states, with notable contributions from Andhra Pradesh (27,651 enterprises), Kerala (34,569), and Uttar Pradesh (28,904).
- Banking Correspondent Sakhis:
- Role: Women in SHGs are trained as Banking Correspondent Sakhis to enhance access to banking services such as deposits, credit, remittances, pensions, and insurance in rural areas.
- Current Deployment: 1,35,127 Sakhis have been deployed under DAY-NRLM, empowering women to be financial intermediaries in their communities.
- Financial Support for SHGs:
- Revolving Fund: SHGs receive funds ranging from Rs. 20,000 to Rs. 30,000 to boost their operations and financial stability.
- Community Investment Fund: SHGs can avail of up to Rs. 2.50 lakh under the Community Investment Fund to strengthen their financial position.
- Interest Subvention: To make bank loans more affordable, DAY-NRLM provides interest subvention to SHGs, reducing their overall credit costs.
- Online Marketing Platform:
- www.esaras.in: This online platform allows SHGs to market their products, improving their access to broader markets and enhancing their income-generating potential.
Impact of DAY-NRLM and SHGs
- Financial Inclusion: SHGs play a vital role in financial inclusion by providing access to banking services, loans, and insurance to women, especially in rural and remote areas.
- Credit Mobilization: As of November 2024, SHGs have leveraged Rs. 9.71 lakh crore in bank credit, thanks to the capitalization support provided by DAY-NRLM, including Revolving Funds and Community Investment Funds.
- Empowerment of Women: SHGs have significantly contributed to the empowerment of women, providing them with financial independence, social support, and the ability to make decisions in their households and communities.
Challenges Faced by SHGs
- Beneficiary Identification: Ensuring that the most marginalized individuals are included in SHGs can be challenging.
- Training Gaps: There is a lack of quality training programs and expert trainers to build the capacity of SHG members.
- Financial Literacy: Many SHG members have limited knowledge of formal financial services, hindering effective financial management.
- Market Linkages: Poor integration with markets limits the growth potential of SHGs, especially in terms of product sales and business expansion.
- Community Support: Insufficient business environment support and value chain linkages pose challenges to SHG sustainability and growth.
Government Initiatives Supporting SHGs
- SHG-Bank Linkage Programme (SBLP): Launched by NABARD in 1992, this initiative aims to link SHGs with formal banking institutions, facilitating financial inclusion.
- Mission for Financial Inclusion (MFI): A broader initiative to ensure that rural populations have access to affordable financial services such as savings, credit, insurance, and pensions.
- Lakhpati Didi Initiative: Launched in 2023, this initiative empowers SHG women to adopt sustainable livelihood practices and aim for an annual household income exceeding Rs. 1 lakh.
Role of SHGs in Rural Development
- Women Empowerment: SHGs have emerged as a powerful tool for empowering women through financial independence, social security, and the ability to make informed decisions.
- Economic Growth: SHGs foster small-scale entrepreneurship, thereby creating local businesses that contribute to rural economic growth.
- Social Cohesion: By promoting collective action, SHGs provide a social support system that helps in addressing common issues faced by their members, such as health, education, and safety.
Future Prospects and Way Forward
- Technological Integration: SHGs should leverage advanced digital platforms for transaction management, record-keeping, and communication, enhancing efficiency and accessibility.
- Reducing Informal Borrowing: Linking SHGs with formal financial institutions will reduce reliance on informal lenders, promoting financial inclusion.
- Inclusive Approach: SHGs should adopt an inclusive model to ensure that members from diverse socio-economic backgrounds are fairly represented and benefit equally.
- Training and Capacity Building: There is a need for more Community Resource Persons (CRPs) who can guide SHGs in beneficiary identification, financial management, and scaling their activities.
The Costly Push for 100% Electrification of Indian Railways
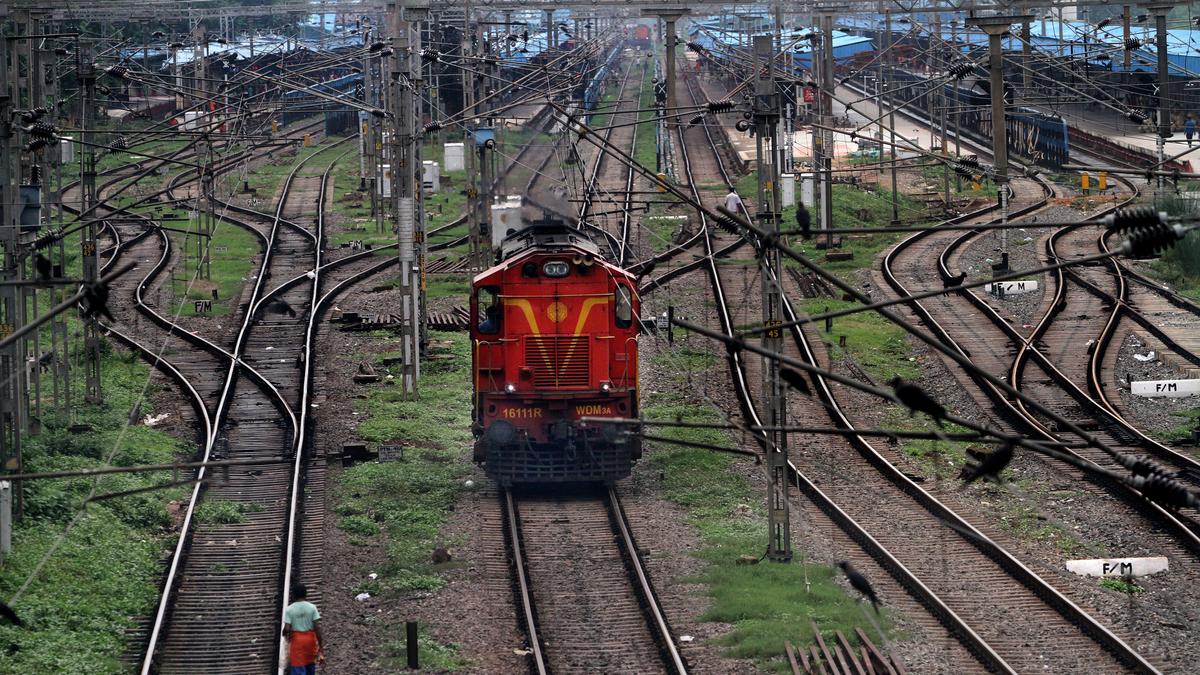
- 19 Dec 2024
Introduction
RITES Ltd., the consultancy arm of the Indian Railways, has secured two contracts to repurpose six broad gauge diesel-electric locomotives for export to African railways. These locomotives, originally designed for India’s broad gauge of 1,676 mm, will be modified for use on railways with the narrower Cape Gauge of 1,067 mm. While this is a commendable re-engineering effort, it also highlights a larger issue within Indian Railways: the unnecessary redundancy of functional diesel locomotives, leading to significant wastage of resources.
The Growing Problem of Idle Diesel Locomotives
As of March 2023, there were 585 diesel locomotives idling across the Indian Railways network due to electrification. This number has now reportedly grown to 760 locomotives, many of which still have more than 15 years of serviceable life. The root cause of this redundancy lies in the government’s mission to electrify the entire broad gauge network at an accelerated pace. This electrification push has resulted in the premature retirement of locomotives that could still serve the network for years, raising questions about the economic and environmental logic behind this decision.
The Justification for Electrification: Foreign Exchange and Environmental Concerns
The Indian government’s electrification drive is often justified on two primary grounds: saving foreign exchange by reducing the import of crude oil and reducing environmental pollution. Additionally, electrification is framed as a step toward a “green railway” powered by renewable energy sources like solar and wind. However, the reality of these claims is more complicated.
Foreign Exchange Savings: A Small Impact on National Diesel Consumption
While electrification may reduce India’s diesel consumption, the impact on national fuel use is minimal. Railways account for just 2% of the country’s total diesel consumption. A report by AC Nielsen in 2014 indicated that the transport sector consumed 70% of the total diesel, with railways accounting for only 3.24%. Even with 100% electrification, the savings in foreign exchange would have little impact on the country’s overall diesel consumption, leaving other sectors like trucking and agriculture as the main contributors.
Environmental Concerns: Shifting Pollution, Not Reducing It
The environmental argument for electrification is also flawed. Electricity in India is still largely generated from coal-fired power plants, with nearly 50% of the country’s electricity coming from coal. Since the Indian Railways is heavily involved in transporting coal, switching from diesel to electric locomotives simply shifts pollution from the tracks to the power plants. This means that the transition to electric traction will not result in a cleaner environment unless the country significantly reduces its reliance on coal. Without a substantial increase in renewable energy generation, the push for a “green railway” remains unrealistic.
The Dilemma of Retaining Diesel Locomotives for Strategic Purposes
Despite the goal of 100% electrification, a significant number of diesel locomotives will remain in service. Reports indicate that 2,500 locomotives will be kept for “disaster management” and “strategic purposes,” although it is unclear why such a large fleet is necessary for these purposes. Additionally, about 1,000 locomotives will continue to operate for several more years to meet traffic commitments. This suggests that even with a fully electrified network, Indian Railways will continue to rely on thousands of diesel locomotives, many of which have substantial residual service life left.
Financial Sustainability and Coal Dependency
The financial sustainability of this transition remains a concern. Currently, the Indian Railways generates a significant portion of its freight revenue from transporting coal—40% of its total freight earnings in 2023-24. If the railways become fully electrified, it will need to find alternative revenue sources, as coal is a primary contributor. Until non-coal freight options can replace this income, the financial health of the railways may be at risk.
Conclusion: Wasted Resources and Unmet Goals
The mission to electrify the Indian Railways, while ambitious, is an example of how vanity projects can lead to colossal waste. Thousands of diesel locomotives are being discarded prematurely, despite their potential to continue serving the network. The environmental and financial justifications for 100% electrification, while appealing in theory, fail to account for the complexities of India’s energy landscape. As a result, the drive to create a “green railway” is likely to fall short, leaving behind a legacy of wasted taxpayer money and unfinished goals.
Arctic Tundra: From Carbon Sink to Carbon Source

- 18 Dec 2024
In News:
The Arctic tundra, a frozen, treeless biome, has historically been a vital carbon sink, absorbing vast amounts of carbon dioxide (CO?) and other greenhouse gases (GHGs). However, recent findings suggest that, for the first time in millennia, this ecosystem is emitting more carbon than it absorbs, a change that could have significant global consequences. This alarming shift was highlighted in the 2024 Arctic Report Card published by the National Oceanic and Atmospheric Administration (NOAA).
The Arctic Tundra’s Role as a Carbon Sink
The Arctic tundra plays a crucial role in regulating the Earth's climate. In typical ecosystems, plants absorb CO? through photosynthesis, and when they die, carbon is either consumed by decomposers or released back into the atmosphere. In contrast, the tundra’s cold environment significantly slows the decomposition process, trapping organic carbon in permafrost—the permanently frozen ground that underpins much of the region.
Over thousands of years, this accumulation of organic matter has resulted in the Arctic storing an estimated 1.6 trillion metric tonnes of carbon. This figure is roughly double the amount of carbon in the entire atmosphere. As such, the tundra has served as a critical carbon sink, helping to mitigate global warming by trapping vast quantities of CO?.
Shifting Dynamics: Emission of Greenhouse Gases
Recent reports indicate a dramatic shift in the Arctic tundra’s role in the carbon cycle. Rising temperatures and increasing wildfire activity have disrupted the tundra’s balance, leading it to transition from a carbon sink to a carbon source.
Impact of Rising Temperatures
The Arctic region is warming at a rate approximately four times faster than the global average. In 2024, Arctic surface air temperatures were recorded as the second-warmest on record since 1900. This rapid warming is causing permafrost to thaw, which in turn activates microbes that break down trapped organic material. As this decomposition accelerates, carbon in the form of CO? and methane (CH?)—a more potent greenhouse gas—are released into the atmosphere.
The experts, explained the process by comparing thawing permafrost to meat left out of the freezer. Similarly, thawing permafrost accelerates the breakdown of trapped carbon.
The Role of Wildfires
In addition to warming temperatures, the Arctic has experienced a surge in wildfires in recent years. 2024 marked the second-highest wildfire season on record in the region, releasing significant amounts of GHGs into the atmosphere. Wildfires exacerbate the thawing of permafrost, creating a feedback loop where increased carbon emissions contribute further to warming, which, in turn, leads to more emissions.
Between 2001 and 2020, these combined factors caused the Arctic tundra to release more carbon than it absorbed, likely for the first time in millennia.
The Global Consequences of Emission
The transition of the Arctic tundra from a carbon sink to a carbon source is alarming, as it represents a significant amplification of global climate change. The release of additional CO? and CH? into the atmosphere further accelerates the greenhouse effect, leading to higher global temperatures. This warming is already having visible consequences around the world, from extreme weather events to rising sea levels.
If the Arctic tundra continues to emit more carbon than it absorbs, it could significantly exacerbate the climate crisis. The report underscores the urgency of addressing global emissions, as reducing greenhouse gases remains the most effective way to prevent further destabilization of this sensitive ecosystem.
Mitigating the Impact: The Path Forward
Despite the alarming trends, the Arctic Report Card suggests that it is still possible to reverse this process. By reducing global GHG emissions, it may be possible to slow the thawing of permafrost and allow the Arctic tundra to regain its role as a carbon sink. Scientists emphasize that mitigating climate change on a global scale is essential to prevent further emissions from the Arctic ecosystem.
Scientists, stressed the importance of emission reductions, stating, “With lower levels of climate change, you get lower levels of emissions from permafrost… That should motivate us all to work towards more aggressive emissions reductions.”
However, current trends suggest that achieving this goal may be challenging. A recent report from the Global Carbon Project indicates that fossil fuel emissions are likely to rise in 2024, with total CO? emissions projected to reach 41.6 billion tonnes, up from 40.6 billion tonnes in 2023.
How would a carbon market function?
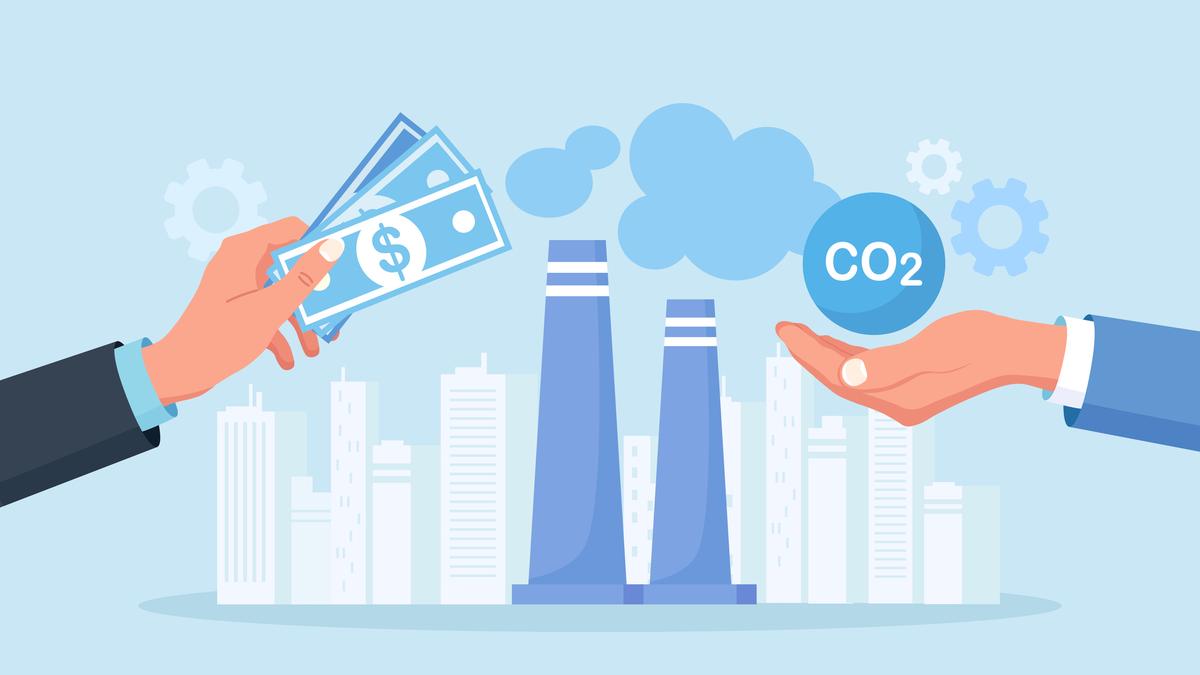
- 16 Dec 2024
In News:
COP29, the ongoing climate conference in Azerbaijan’s capital Baku, has given a fillip to the idea of using carbon markets to curb carbon emissions by approving standards that can help in the setting up of an international carbon market as soon as the coming year.
Introduction to Carbon Markets
- Carbon markets allow the buying and selling of the right to emit carbon dioxide (CO2) into the atmosphere.
- Governments issue certificates known as carbon credits, each representing the right to emit 1,000 kilograms of CO2.
- The total number of credits issued is capped to control carbon emissions. Companies and individuals who don’t have credits cannot emit CO2.
Trading of Carbon Credits
- Carbon Credit Trading: Companies holding more carbon credits than needed can sell them to others who need more, with the price determined by market forces.
- Carbon Offsets: Businesses can also purchase carbon offsets, often provided by environmental NGOs, which promise to reduce emissions (e.g., by planting trees). These offsets counterbalance the firm’s carbon emissions.
- The trading of both credits and offsets is designed to create financial incentives for companies to reduce their carbon footprint.
Advantages of Carbon Markets
- Addressing Externalities: Carbon emissions are a classic example of an economic externality, where the costs of pollution are not reflected in market prices.
- Market Efficiency: By allowing firms to buy and sell carbon credits, the system internalizes the cost of carbon emissions, encouraging businesses to reduce emissions to avoid higher costs.
- Incentive for Emission Reduction: Carbon markets aim to create a financial reason for companies to lower their emissions, thus helping mitigate climate change.
Voluntary vs. Government-Mandated Carbon Markets
- Voluntary Carbon Reporting: Many corporations prefer voluntary systems like the Carbon Disclosure Project (CDP) for reporting their emissions, fearing government-imposed restrictions.
- Market Flexibility: Corporations like ExxonMobil and General Motors argue that carbon markets with freely traded credits allocate carbon allowances more efficiently than government-imposed limits. This allows firms to purchase credits from others, optimizing resource allocation without restricting output.
- Corporate Resistance to Government Intervention: Firms are often reluctant to accept strict government budgets for carbon emissions, fearing increased operational costs and production limitations due to diverse supply chains.
Issues and Criticisms of Carbon Markets
- Government Manipulation of Credit Supply: Governments may increase the number of carbon credits issued, leading to lower prices and reduced incentives for emission reductions.
- Lack of Accountability in Carbon Offsets: Critics argue that some companies buy carbon offsets as a form of virtue signalling, without genuine concern for their environmental impact. This undermines the effectiveness of the offsets.
- Government Mismanagement: Political decision-making may lead to the over-restriction of carbon credits, potentially slowing economic growth by limiting available emissions allowances. The ability of governments to accurately determine the optimal supply of carbon credits is a contentious issue.
The Concept of Carbon Credits and Their History
- Introduction of Carbon Credits: Carbon credits were first introduced in the 1990s in the U.S., specifically through a cap-and-trade model designed to control sulfur dioxide emissions. This approach later expanded to include carbon emissions.
- Role of Carbon Markets: In essence, these markets aim to create a financial mechanism where firms can trade the right to pollute, ensuring a balance between economic growth and environmental protection.
Criticism of Carbon Offsets
- Effectiveness of Offsets: Experts are critical of carbon offsets, arguing that they do not always lead to meaningful reductions in emissions. For example, some companies may purchase offsets without ensuring that the projects are genuinely offsetting their emissions.
- Moral Hazard: Critics suggest that offset programs may lead to firms simply paying for the right to pollute, rather than actually reducing emissions in their operations.
Conclusion
- Carbon Markets as a Tool for Emission Reduction: Despite the criticisms, carbon markets remain a promising tool for mitigating climate change, provided they are carefully regulated and implemented.
- The Future of Carbon Trading: As discussions at COP29 evolve, the development of international standards for carbon trading could potentially enhance the effectiveness of these markets, offering a viable path to global emission reductions.