Supply and Use Tables 2020–21 & 2021–22
- 02 Aug 2025
In News:
Recently, the Ministry of Statistics and Programme Implementation (MoSPI) released the Supply and Use Tables (SUTs) for 2020–21 and 2021–22.
What are Supply and Use Tables?
SUTs consist of two interlinked matrices—Supply Tables and Use Tables, organized in a product-by-industry format.
- Supply Table: Captures total supply of goods and services, combining domestic production (at basic prices) and imports.
- Use Table: Reveals how these products are used across the economy—intermediate consumption, final consumption, capital formation, and exports (at purchasers’ prices).
Purpose & Significance of SUT
- Integration of GDP Approaches: SUT unifies production, income, and expenditure methods for GDP calculation, helping reconcile discrepancies between them.
- Robust Analytical Tool: Offers granular insights into product-industry dynamics, facilitating better policymaking and economic analysis.
- Data Reconciliation: Aligns macroeconomic estimates from sources like National Accounts Statistics (NAS), ASI, RBI, EXIM data, and census, improving coherence.
Data Coverage & Compilation Methodology
- Scope: Covers 140 products and 66 industries, at current prices, aligned with UN’s System of National Accounts (SNA).
- Key Steps:
- Identify industries (via NIC, NAS compilation categories) and products (via NPCMS for manufacturing, NPCSS for services).
- Compile Supply Table at basic prices; translate to purchasers’ prices using tax, margin, and CIF adjustments.
- Compile Use Table, detailing intermediate and final uses.
- Balance product supply and use to ensure consistency.
- Data Sources: NAS, ASI, EXIM, RBI, CBIC, MCA, Cost of Cultivation, etc.
Key Highlights
|
Metric |
2020–21 |
2021–22 |
|
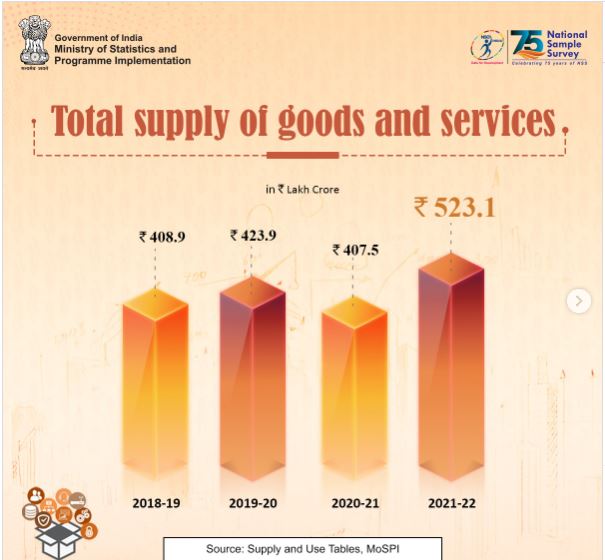
Total Supply (Purchasers’ Prices) |
?407.52 lakh crore |
?523.08 lakh crore |
|
Sectoral Composition (basic prices) |
Agriculture: 11–13%, Mining: 2%, Manufacturing: 30–33%, Manufacturing-related services: 3%, Other Services: ~55% |
GVA-to-GVO Ratios (Efficiency Indicators)
- Top-performing industries (high ratios):
- 2020–21: Ownership of Dwellings, Fishing & Aquaculture, Forestry & Logging, Agriculture, Education & Research
- 2021–22: Ownership of Dwellings, Fishing & Aquaculture, Forestry & Logging, Agriculture, Crude Petroleum
- Low-performing industries (low ratios):
- 2020–21: Meat processing, Dairy, Grain mill & animal feeds, Communication equipment, Other manufacturing
- 2021–22: Similar, with Coke & Refined Petroleum added
Consumption Patterns
- Intermediate Consumption: Highest share by Construction—13.82% (2020–21), 14.03% (2021–22).
- Consumption Composition:
- 2020–21: Intermediate: Goods 70%, Services 30%; PFCE: Goods 62%, Services 38%
- 2021–22: Intermediate: Goods 72%, Services 28%; PFCE: Goods 59%, Services 41%
GDP Discrepancy Reconciliation
- 2020–21: Discrepancy of –?2,46,154 crores; reconciled by reducing PFCE by ?3,05,628 cr; Inventory by ?18,897 cr; Imports by ?78,374 cr.
- 2021–22: Discrepancy of –?2,16,579 crores; PFCE cut by ?3,55,540 cr; Inventory by ?1,884 cr; Imports by ?1,37,081 cr.
Significance
- Macro-Accounting Sophistication:SUT represents India’s advanced approach to reconciling diverse economic indicators—critical for accurate GDP estimation.
- Policy Insights:Understanding sectoral efficiencies (via GVA-to-GVO), product dependencies, and consumption structures can guide targeted reforms.
- Post-Pandemic Recovery Landscape:The sharp increase in total supply (28.4% growth) between 2020–21 and 2021–22 reflects economic resilience and rebound.
- Data-Driven Governance: SUT’s transparency and granularity strengthen evidence-based policymaking.
- Statistical Infrastructure Evolution: Proposals for SME/MNE disaggregation, real-time dashboards, and annual updates align India with OECD’s extended SUT models and global best practices.