Quality of Public Expenditure (QPE) Index
- 25 Feb 2025
In News:
The Quality of Public Expenditure (QPE) Index, developed by the Reserve Bank of India (RBI), measures how efficiently public funds are allocated and utilized by the Central and State governments. Unlike traditional fiscal measures that focus on total expenditure, the QPE Index assesses the composition and developmental impact of government spending, emphasizing long-term economic growth and social development.
Key Components of the QPE Index
Indicator What it Measures Significance
Capital Outlay to GDP Ratio - Share of GDP spent on physical infrastructure - Higher ratio = better quality of expenditure
Revenue Expenditure to Capital Outlay Ratio - Relative spending on salaries, pensions vs. asset creation - Lower ratio = better efficiency
Development Expenditure to GDP Ratio - Spending on education, healthcare, R&D, infrastructure - Higher ratio = enhanced productivity
Development Expenditure as % of Total Expenditure - Proportion of total expenditure directed to development sectors - Higher share = improved allocation
Interest Payments to Total Expenditure Ratio - Financial burden from past borrowings - Lower ratio = better fiscal health
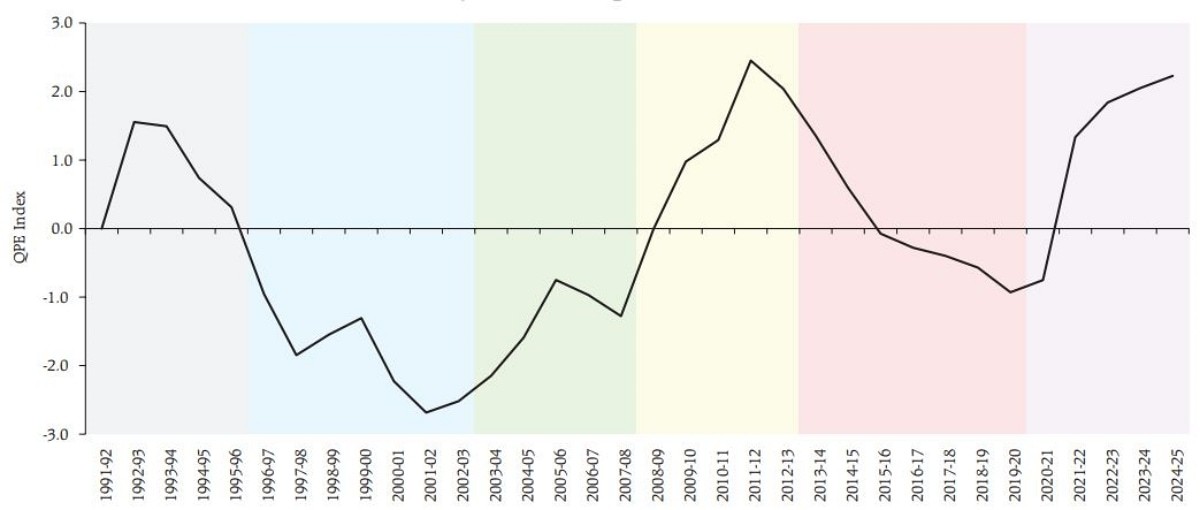
Evolution of Public Expenditure (1991–2025)
- 1991–1997(Early liberalization):
- Slight improvement at Centre; states faced fiscal pressure.
- Public investment declined due to focus on fiscal deficit reduction.
- 1997–2003:Decline in QPE due to Fifth Pay Commission, rising interest burden, dominance of revenue expenditure.
- 2003–2008(FRBM Era):
- Fiscal Responsibility and Budget Management (FRBM) Act, 2003 improved fiscal discipline.
- States gained from higher tax devolution; capital spending rose.
- Growth momentum sustained until the 2008 Global Financial Crisis (GFC).
- 2008–2013(GFC response):
- Stimulus spending initially boosted development but later widened fiscal deficits.
- Spending quality eroded over time.
- 2013–2019(GST & 14th Finance Commission):
- 14th Finance Commission (2015) increased states' tax share to 42%, improving state-level development spending.
- GST rollout (2017) benefited states more than Centre initially, stressing Centre’s finances.
- 2019–2025(COVID-19 & Recovery):
- Pandemic-induced fiscal stimulus reduced QPE temporarily.
- Post-pandemic recovery led by record capital expenditure boosted infrastructure, improving QPE.
- By FY 2024–25, India's QPE reached its highest level since 1991 reforms.
Recent Trends in Public Expenditure (as per Economic Survey 2024–25 & Budget 2025–26)
- Capital expenditure (Capex) rose 8.2% YoY.
- Revenue expenditure (primarily by states) increased 12% YoY.
- FY 2025–26 Budget allocated ?11.21 lakh crore for Capex (3.1% of GDP).
- Capex to GDP ratio increased from 1.5% in 2000 to 2.5% in 2023.
- Revenue expenditure to Capex ratio improved from 8:1 in 2000 to 5:1 in 2023.
- Development expenditure rose from 6% to 8% of GDP between 2000–2023.
- Interest payments declined from 25% to 20% of total expenditure in the same period.
Why Quality of Public Expenditure Matters
- Governments use citizens’ money (via taxes or borrowing). Efficient use ensures better socio-economic outcomes.
- High QPE means greater focus on productive investment over populist spending (freebies, subsidies).
- Better QPE leads to:
- Higher GDP growth (average 6.5% annually since 2000).
- Improved infrastructure and service delivery.
- Enhanced social indicators like literacy (77.7% in 2023) and life expectancy (70 years).
Challenges Affecting Public Expenditure Quality
- Persistent revenue deficits (3.3% of GDP in 2023) limit fiscal space for Capex.
- Rising populism: Loan waivers, cash handouts, free electricity.
- Welfare scheme inefficiencies: Leakages in MGNREGA, PDS.
- Debt servicing: High interest payments constrain spending.
- Inter-state disparities: Unequal fiscal capacity hampers balanced development.
Way Forward
- Boost Capex to over 3% of GDP to enhance infrastructure-led growth.
- Rationalize subsidies via Direct Benefit Transfers (DBT).
- Strengthen fiscal federalism through equitable devolution and performance-based grants.
- Leverage technology for transparent and outcome-based expenditure tracking.
- Reform FRBM Act:
- Focus on debt-to-GDP targets.
- Introduce flexibility in deficit norms during crises.