India’s GDP Growth at 7.7% in FY 2025–26
- 10 Jun 2026
In News:
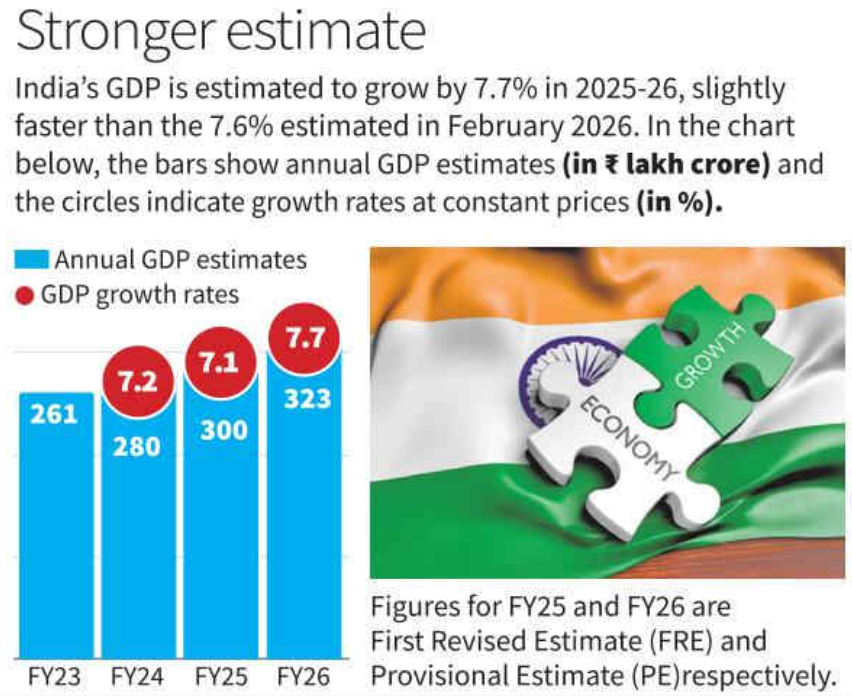
The Ministry of Statistics and Programme Implementation (MoSPI) has released the Provisional Estimates of National Income, placing India’s GDP growth at 7.7% in FY 2025–26, slightly higher than the 7.6% estimate released earlier in February 2026. The latest figures reaffirm India's position as one of the world's fastest-growing major economies despite global economic and geopolitical uncertainties.
What is GDP?
- Gross Domestic Product (GDP) measures the total monetary value of all final goods and services produced within a country's borders during a specific period. It is the most widely used indicator of economic growth and overall economic health.
Key Highlights of the Estimates
- India's economy recorded a robust expansion during FY 2025–26, with real GDP growth reaching 7.7%, while growth in the fourth quarter (Q4) stood at 7.8%, indicating sustained economic momentum.
- Growth was driven primarily by strong performance in manufacturing and services. The manufacturing sector expanded by 7%, reflecting improving industrial activity, while the broad services segment comprising trade, transport, hotels, communication and related services registered an impressive 11% growth, emerging as the key growth driver.
- Domestic demand also remained strong. Private Final Consumption Expenditure (PFCE), a key indicator of household spending, grew by 7.2%, signalling resilient consumer demand. At the same time, Gross Fixed Capital Formation (GFCF), which reflects investment in productive assets, increased by 8.2%, pointing towards sustained investment activity in the economy.
- Agriculture recorded moderate but stable growth of around 4%, supported by favourable monsoon conditions and improved rural demand, though its growth remained lower than that of manufacturing and services.
Significance
The latest GDP estimates highlight the resilience of India's domestic economy amid external challenges such as geopolitical conflicts, global trade uncertainties and slowing growth in several advanced economies.
Strong growth in manufacturing, services, consumption and investment is important because it:
- Supports employment generation.
- Increases household incomes and consumer spending.
- Enhances government tax revenues and fiscal capacity.
- Encourages private sector investment.
- Strengthens India's attractiveness as a global investment destination.
The data also suggests that India's growth continues to be driven by a combination of domestic consumption, capital formation and services-sector expansion, making the economy relatively less vulnerable to external shocks.
End of the ‘Cheap Money’ Era
- 03 Jun 2026
In News:
The Reserve Bank of India (RBI), in its Annual Report 2025–26, has cautioned about rising sovereign bond yields across major economies and the possibility of a reversal in monetary easing by global central banks. This signals the gradual end of the long phase of ultra-low interest rates and abundant global liquidity that characterized the post-2008 and post-pandemic world economy.
Understanding the Context
A government bond is a debt instrument issued by a sovereign government to raise funds. In return, the government pays periodic interest and repays the principal at maturity. Since sovereign governments back these securities, they are generally considered among the safest financial assets.
The return earned on these securities is known as the bond yield, which acts as a benchmark for interest rates across the economy. Higher bond yields typically translate into higher borrowing costs for governments, businesses, and households.
The era of cheap money was largely driven by Quantitative Easing (QE), a monetary policy under which central banks created new money to purchase government bonds and long-term assets. This increased liquidity, reduced interest rates, and encouraged lending and investment.
The Rise and Fall of Cheap Global Money
Following the 2008 Global Financial Crisis and later the COVID-19 pandemic, central banks in advanced economies maintained exceptionally low interest rates and pursued aggressive QE policies.
As a result:
- US bond yields declined from over 6% in the late 1990s and early 2000s to around 0.9% during 2020–21.
- UK yields fell from 5.4% to 0.4%.
- Japan's yields approached zero, and even turned negative during 2016–17 and 2019–20.
This abundance of low-cost capital pushed global investors towards emerging markets such as India in search of higher returns.
However, the situation has changed dramatically. Supply-chain disruptions after COVID-19, the Russia–Ukraine conflict, tariff actions under the Trump administration in 2025, and the ongoing US–Israel versus Iran conflict have revived inflationary pressures globally. Consequently, central banks have moved away from ultra-loose monetary policies.
Rising Global Bond Yields
The reversal is visible in sovereign bond markets:
- Japan: Average yield of 1.8% in 2025–26, rising to 2.5%, with a peak of 2.8% in May 2026.
- United States: Average yield of 4.2%, rising to 4.4%, with a high of 4.7%.
- United Kingdom: Average yield of 4.6%, increasing to 4.9%, with a high of 5.2%.
These figures indicate that global capital is becoming increasingly expensive.
Implications for India
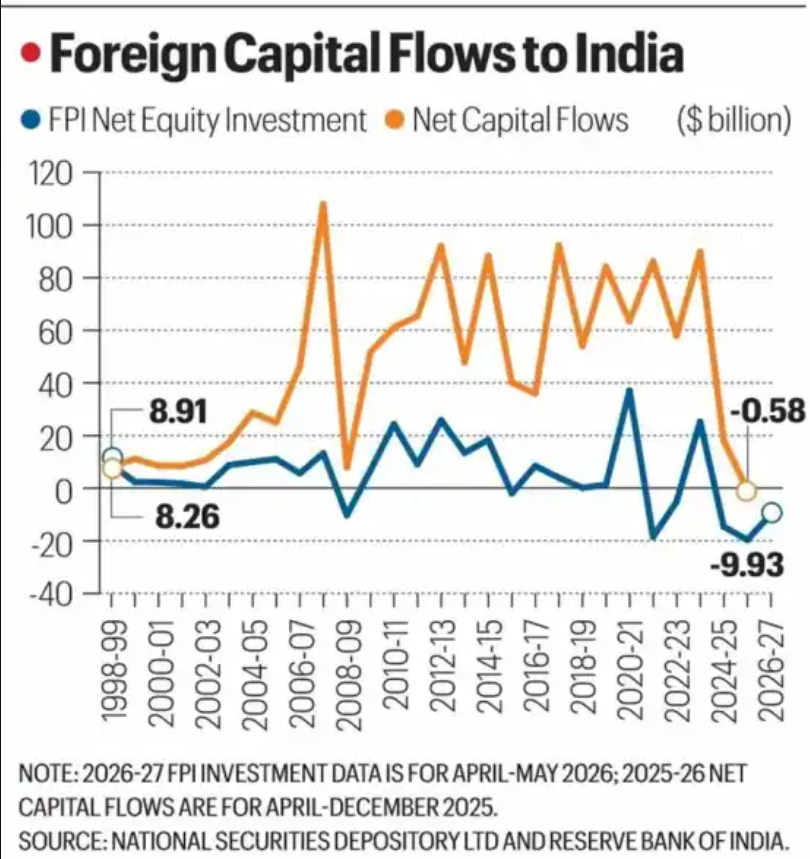
India benefited significantly from global liquidity during the cheap-money era. Net capital inflows rose from $8.3 billion in 1998–99 to a record $107.9 billion in 2007–08, and averaged $67.3 billion annually between 2009–10 and 2023–24. However, inflows fell sharply to $18 billion in 2024–25, while the first nine months of 2025–26 recorded net capital outflows of $580 million.
Another concern is the narrowing yield gap between Indian and US government bonds. India's 10-year government bond yield is around 7%, while the US 10-year Treasury yield is about 4.5%, leaving a differential of only 2.5 percentage points, compared to a historical average of more than 4 percentage points. After accounting for rupee depreciation and the safe-haven appeal of US Treasuries, Indian assets become relatively less attractive to foreign investors.
This could result in:
- Lower foreign capital inflows.
- Increased pressure on the rupee.
- Higher borrowing costs for governments and businesses.
- Greater stock market volatility.
- Challenges in financing current account deficits.
The Way Forward
In a world where capital is no longer abundant and cheap, India must increasingly rely on its own economic fundamentals. Sustaining high GDP growth, maintaining macroeconomic stability, expanding manufacturing through initiatives such as Make in India and PLI schemes, deepening domestic financial markets, and attracting stable long-term FDI will be crucial.
The RBI's warning highlights a broader structural shift in the global economy. As the era of easy money fades, countries will have to compete for investment on the basis of growth prospects, policy credibility, and economic resilience rather than merely benefiting from excess global liquidity.
India's Semiconductor Roadmap: NITI Aayog's 10-Year Vision
- 06 Jun 2026
In News:
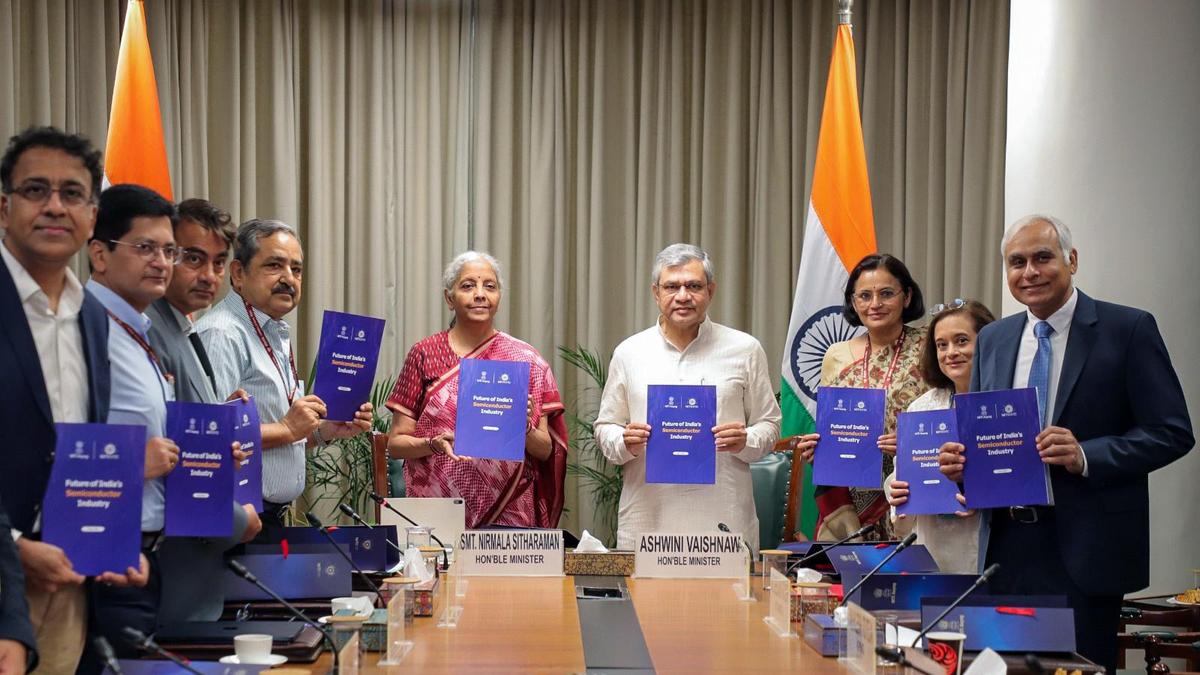
Union Finance Minister Nirmala Sitharaman and IT Minister Ashwini Vaishnaw jointly launched the NITI Aayog Frontier Tech Hub's report titled "Future of India's Semiconductor Industry" — India's first comprehensive 10-year roadmap for the semiconductor sector. The joint launch signals cross-ministerial ownership across Finance, MeitY, and NITI Aayog.
India's Current Status
- India currently does not possess a fully operational semiconductor fabrication plant. The first fab, expected in Dholera, Gujarat, may become operational by 2028. Around 10 semiconductor projects are under various stages of development. India imports nearly all its semiconductor requirements, making the economy vulnerable to global supply chain disruptions.
- The Union government had earlier launched the India Semiconductor Mission (ISM) with a corpus of ?76,000 crore, providing capital subsidies of over 50% for fabrication units, supporting compound semiconductors, packaging facilities, and design-linked incentives for startups.
Key Findings of the Report
- The report explicitly states that India's local ecosystem is not ready to fully meet domestic demand. Many semiconductor components used in defence systems are sourced from outside India, posing national security risks.
- Taiwan dominates global chip manufacturing; a disruption there could massively impact India's electronics supply chain. Fabrication units require 4–5 years before commencing production, and the sector demands "sustained, mission-mode commitment over a decade or more."
Strategic Vision: $120–150 Billion by 2035
- The report presents a strategic blueprint to establish a USD 120–150 billion semiconductor ecosystem by 2035. Rather than competing in the capital-intensive race for cutting-edge wafer fabrication, the roadmap advocates a "More-than-Moore" strategy focused on mature logic nodes, advanced OSAT (Outsourced Semiconductor Assembly and Test) packaging, and specialised wide-bandgap compound materials.
Capital Requirements and ISM 2.0
- The report estimates state capital expenditure of $45–60 billion over a decade for the second phase (ISM 2.0). The roadmap directly reinforces priorities announced under India Semiconductor Mission 2.0 in Union Budget 2026, marking India's shift from ecosystem creation to ecosystem deepening — from attracting investments to developing deeper capabilities across design, materials, manufacturing, packaging, talent, R&D, and trusted global partnerships.
Strategic Focus Areas
- The report steers away from frontier chips (3–7 nanometre nodes) where risks are very high, and instead prioritises mature and advanced nodes, compound semiconductors for defence and industrial applications, and advanced chip packaging as a "core production pillar." Clear goals include positioning India as a leading global destination for advanced packaging and OSAT, building leadership in compound semiconductor manufacturing, and creating more than 100 advanced semiconductor design IPs.
Trusted Partners and Geopolitics
Priority partner nations identified are the United States, Japan, the European Union, and South Korea — for access to critical tools, technology transfer, and joint R&D. The report implicitly treats China as an adversarial player, reflecting the broader global semiconductor realignment away from Chinese supply chains.
New WPI Series and Transition to Producer Price Index (PPI)
- 05 Jun 2026
In News:
Recently, the Department for Promotion of Industry and Internal Trade (DPIIT) under the Commerce Ministry will release a revised Wholesale Price Index (WPI) series with 2022-23 as the new base year, replacing the 2011-12 series. Simultaneously, India will introduce a comprehensive Producer Price Index (PPI) framework — with the WPI expected to be discontinued by 2031 after a five-year transition.
This reform is part of India's broader statistical overhaul in 2026, following base year revisions to GDP, CPI, and IIP — all updated to 2022-23.
Key Features of the Revised WPI
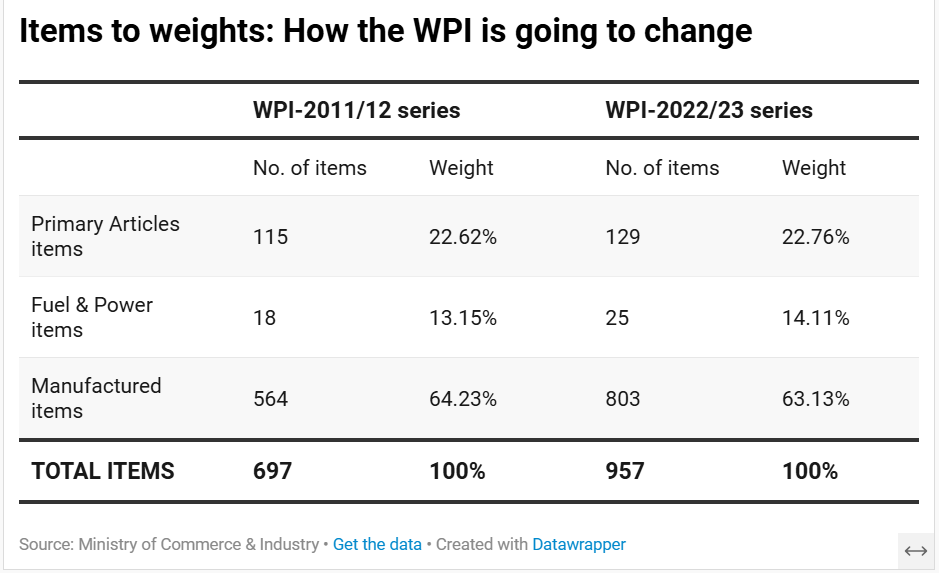
The commodity basket has been expanded from 697 items to 957 items, with new additions including solar energy, wind energy, nuclear electricity, and other emerging sectors. The revised series will be released with data from May 2026, along with a back-series from April 2023.
The New PPI Framework
Three types of PPIs will be released simultaneously on June 15:
- Output PPI measures prices received by producers at the farm gate or factory gate. It excludes indirect taxes and trade/transport margins. It will initially cover 125 items, expanding to approximately 1,500 items once the WPI is discontinued. This index will be released monthly, with a back-series from April 2023.
- Input PPI (experimental) measures prices paid by producers for inputs, including trade and transport margins. It is being introduced for the manufacturing sector on a trial basis starting March 2026, with validation expected over approximately two years.
- Services PPI covers seven major services: banking, securities transactions, insurance, pension fund management, railways, air passenger transport, and telecommunications. It will be released quarterly, with the first data covering January–March 2026.
All three PPIs carry 2022-23 as the base year.
Why Transition from WPI to PPI?
WPI only tracks goods prices, leaving India's increasingly service-driven economy out of the measurement framework. PPI addresses this gap. Additionally, the output PPI is more consistent with the national accounts framework — the IMF and other global institutions have long advocated PPI adoption for accurately deflating nominal GDP into real GDP. Currently, India uses a combination of WPI and CPI to compute real GDP; once the PPI series stabilises, the output PPI is expected to serve as a more accurate deflator, improving the robustness and international comparability of India's GDP estimates.
Five-Year Transition (2026–2031)
WPI remains widely embedded in long-term procurement contracts, infrastructure agreements, construction projects, and price escalation clauses. To avoid disruption, WPI and PPI will be published in parallel for five years. The Ministry of Finance's Department of Expenditure will issue a circular directing users that fresh long-term contracts extending beyond 2031 should adopt PPI-based escalation mechanisms.
Challenges
Building reliable producer-level price databases — especially for services — is complex. Input PPI remains experimental. Industries and government departments must adapt existing contracts and data frameworks progressively.
Way Forward
- Strengthen data collection infrastructure: Robust producer-level price databases must be built across manufacturing and service sectors. This requires capacity building in statistical agencies, particularly at the district and firm level.
- Validate the Input PPI: The experimental input PPI for manufacturing needs rigorous quality testing and stakeholder feedback over its trial period before it can be formally adopted.
- Expand services coverage: The initial services PPI covers only seven sectors. A roadmap must be developed to progressively include sectors such as healthcare, education, real estate, and IT services.
- Facilitate contractual transition: Government departments, PSUs, and private firms need clear guidelines and legal frameworks to seamlessly migrate price escalation clauses from WPI to PPI in long-term contracts before the 2031 deadline.
- Coordinate with RBI and MoSPI: Close coordination between DPIIT, MoSPI, and the Reserve Bank of India is essential to ensure PPI data is reliable enough to eventually serve as a GDP deflator, strengthening the quality of national income estimates.
Conclusion
India's transition from WPI to PPI is not merely a statistical exercise — it reflects the structural transformation of the Indian economy from a goods-dominated to a services-led one. The simultaneous release of output PPI, input PPI, and services PPI, alongside the revised WPI, marks a decisive step toward aligning India's price measurement architecture with global best practices. Together with the recent revisions in GDP, CPI, and IIP, this reform signals a maturing of India's statistical system, which is foundational to sound policymaking, credible GDP estimation, and investor confidence.
India's EV Transition: Why the Grid Challenge Is Bigger Than the Vehicle

- 20 May 2026
In News:
Rising crude oil prices and recurring geopolitical tensions in the Strait of Hormuz have accelerated India's push toward electric vehicles (EVs). While electric two-wheelers are gaining rapid urban traction owing to affordability and low maintenance costs, the deeper — and largely underappreciated — challenge lies in building a power grid capable of sustaining large-scale transport electrification, particularly in the freight sector.
The Scale of the Problem
India currently has nearly 420 million registered vehicles. Full electrification of this fleet would demand an additional 900–1,100 TWh of electricity annually — effectively requiring the construction of a second large-scale power system alongside the existing one. Even a partial electrification scenario — where half the fleet transitions by 2047 — would still necessitate approximately 500 TWh of additional generation, equivalent to nearly one-third of India's current annual power output.
This arithmetic makes EV adoption not merely a transport policy question but a fundamental energy infrastructure challenge.
The Visibility Trap: Two-Wheelers vs. Freight
Public discourse around EVs is disproportionately focused on electric scooters and motorcycles — politically visible, subsidy-driven, and rapidly growing. Yet their actual grid burden is modest. Electrifying all 309 million two-wheelers would require only 55–75 TWh annually — less than 7% of total projected EV electricity demand.
The real stress lies in freight. India's approximately 6.26 million heavy goods vehicles (HGVs), each covering nearly 60,000 km per year at high energy intensity, would alone require 450–565 TWh annually if electrified. Including medium goods vehicles (MGVs) pushes total freight electricity demand to 500–600 TWh. In effect, electrifying India's roads means electrifying its supply chains, logistics networks, and industrial transport systems — not merely its consumer commute.
The Evening Peak Crisis
A critical structural vulnerability is the evening peak demand problem. If millions of EVs charge simultaneously after sunset — when solar generation drops — the grid faces severe stress, risking shortages, tariff spikes, and supply instability. Several state discoms already report delays in granting high-tension charging connections due to financial distress and inadequate infrastructure.
Solutions exist — time-of-use pricing, workplace daytime charging, battery-swapping networks, and large-scale energy storage — but India currently lacks a mandatory national standard for smart charging, meaning chargers being installed today without grid-responsive capability could become costly liabilities tomorrow.
What the Grid Must Deliver
Sustainable EV growth demands a diversified and clean energy mix. Solar and wind offer scalable, low-cost generation but are weather-dependent. Nuclear energy provides stable low-carbon baseload but requires long lead times. Pumped hydro, battery storage, and limited gas-based generation are essential for balancing supply-demand mismatches.
Critically, expanding coal dependence to power EVs would negate environmental gains — replacing imported oil with imported coal merely shifts India's energy vulnerability while perpetuating high emissions.
Policy Imperatives
Several institutional and regulatory reforms are essential. EV demand projections must be integrated into national capacity planning. Smart-charging standards must be made mandatory for all new infrastructure. Key freight corridors — the Golden Quadrilateral and Dedicated Freight Corridors — require coordinated power planning before electric trucking scales commercially. The Revamped Distribution Sector Scheme (RDSS) must be leveraged to financially strengthen discoms and improve last-mile electricity delivery. Strong inter-ministerial coordination across transport, power, and finance ministries is non-negotiable.
RBI'S Expected Credit Loss Framework
- 03 May 2026
In News:
The Reserve Bank of India's new Expected Credit Loss (ECL) framework, set to take effect from April 1, 2027, is projected to cause a one-time net capital impact of up to 120 basis points on banks' Common Equity Tier-1 (CET-1) ratios, according to CRISIL Ratings. The gross impact could reach up to 170 bps, with existing provisions reducing the net effect.
What is the ECL Framework?
Currently, Indian banks follow the Incurred Loss Model — provisions are made only after a loan shows stress or becomes a Non-Performing Asset (NPA). This reactive approach often recognises risk too late, allowing banks to report healthy books even when early warning signs are visible.
The ECL framework shifts this to a forward-looking approach. Banks must now estimate losses before default by assessing three parameters:
- Probability of Default (PD)
- Loss Given Default (LGD)
- Exposure at Default (EAD)
The new norms are broadly aligned with IFRS 9, the global accounting standard adopted internationally after the 2008 financial crisis to make banking systems more resilient.
Three-Stage Asset Classification
The ECL framework classifies all loan assets into three stages based on credit risk:
Stage I — Low or no significant increase in credit risk. Banks provision for 12-month expected credit loss. Minimum provisioning levels are broadly similar to current norms but serve only as a floor.
Stage II — Significant increase in credit risk, but not yet an NPA. Banks must provision for lifetime expected credit loss. This stage carries the highest transition impact — Stage II assets currently form only 2–2.2% of the banking system, which will help contain the overall burden.
Stage III — Credit-impaired assets or NPAs. Banks recogniselifetime expected credit loss. Provisioning requirements here will also be higher than the current 15% mandate for sub-standard assets.
A critical shift: banks must now provide more for stressed loans before they cross the traditional 90-day overdue NPA threshold.
New NPA Classification Rules
The 90-day NPA classification period remains unchanged, but classification will now occur at the borrower level, not the account level. This means if one loan of a borrower turns bad, all loans of that borrower with the same bank may be treated as NPAs. Upgrading back to standard status requires the borrower to clear all liabilities, not just the defaulted account. This is expected to strengthen credit discipline and prevent selective repayment.
Additionally, the framework now extends provisioning to off-balance-sheet exposures and undisbursed credit limits — meaning banks must account for committed but yet-to-be-disbursed credit lines as well.
Impact on Banks
- Indian banks are well placed to absorb the transition, supported by a healthy CET-1 ratio of around 14% as of March 31, 2026, and steady profitability, with return on assets of about 1.25–1.3% in the last fiscal. Banks will be allowed to spread the transition impact over four financial years, reducing immediate pressure. Additional provisioning buffers already maintained by several lenders will further cushion the effect.
- However, the ECL regime will also lead to a structural rise in credit costs over time. Banks with higher exposure to microfinance, unsecured retail loans, and other riskier segments face greater pressure on margins. Some of these costs may eventually be passed on to borrowers. Banks will need to proactively focus on strengthening net interest margins and controlling operating expenses to absorb the long-term impact.
- Net NPA ratios for most major Indian banks currently stand below 1%, making this an opportune moment for the transition — the sector's strength reduces the risk of disruption.
Significance
The ECL framework marks a structural upgrade in how Indian banks manage credit risk. It enables earlier detection of stress, builds provisioning buffers in advance, reduces the chance of sudden shocks to balance sheets, and aligns India's banking norms with global standards (IFRS 9). For regulators, it improves transparency and accountability in credit risk assessment, making banking supervision more robust.
Revenue Deficit States and Challenge of Fiscal Stability

- 02 May 2026
In News:
The Ministry of Finance’s Monthly Economic Review (April 2026) has issued a stark warning regarding the divergent fiscal paths of Indian states. As the 16th Finance Commission (FC) period commences, the interplay between rising global energy costs, high debt burdens, and the adherence to the "Golden Rule" of financing has become the focal point of India’s federal economic stability.
1. The Federal Fiscal Landscape: Union vs. States
While the Union government demonstrates resilience, the sub-national level reveals a fragmented picture of fiscal health.
The Union: A Cautious Buffer
The Centre has maintained a prudent fiscal stance, anchored by a conservative tax buoyancy assumption of 0.8. A critical innovation is the Economic Stabilisation Fund (ESF), a ?1-trillion buffer designed to absorb external shocks—such as oil price spikes—without derailing the fiscal deficit target. Despite this, external research firms like BMI suggest a potential breach of the 4.3% deficit target, predicting it could hit 4.5% due to emergency energy subsidies.
The States: A Tale of Two Realities
The performance of 18 large states highlights a divide between fiscal discipline and structural stress:
- Revenue Deficit States: 9 out of 18 states are currently failing to cover their daily expenses with their own earnings. Stressed leaders include Himachal Pradesh (-2.4%), Punjab (-2.2%), and Kerala (-2.1%).
- Revenue Surplus Leaders: Conversely, 8 states are projected to run surpluses, led by Odisha (3%), Jharkhand (2.5%), and Uttar Pradesh (1.6%).
2. Critical Concerns: Energy, Inflation, and Debt
The Energy Trap
With the Indian crude basket hovering between USD 113–115 per barrel, the fiscal math is under pressure. The Union is forced to absorb these costs via higher fertilizer and petroleum subsidies, which drains the ESF. For states, this volatility creates a "double whammy": pressure to cut VAT on fuel while simultaneously facing higher costs for public transport and operations.
The Interest Burden and "Degrees of Freedom"
High debt levels are severely limiting the "degrees of freedom" for stressed states. Punjab represents the extreme, spending 22.8% of its total revenue receipts just on interest payments. When nearly a quarter of income is diverted to servicing old debt, little remains for health, education, or infrastructure.
16th Finance Commission Risks
FY 2026-27 marks the transition to the 16th FC recommendations. The primary risk factor is the absence of Revenue Deficit Grants, which were a lifeline for stressed states under the previous commission. States must now rely more on their own tax efforts and performance-based grants (20% of the total allocation).
3. The ‘Golden Rule’ of Fiscal Financing
The Ministry of Finance has specifically warned states against violating the Golden Rule.
- The Principle: A government should borrow only to fund capital projects (investment) and not for day-to-day consumption (salaries, pensions, and subsidies).
- Intergenerational Equity: Borrowing for a bridge is equitable because future generations benefit from the asset while paying the debt. Borrowing for today’s subsidies, however, shifts the cost to the future with no corresponding asset creation.
- Case Study: Odisha vs. Punjab:
- Odisha budgets a fiscal deficit of 3.5%, seemingly high, but it maintains a 3% revenue surplus. This indicates that its borrowing is entirely "productive," used for a massive capital outlay of 6.5% of GSDP.
- Punjab and Kerala, by contrast, are borrowing to fund revenue deficits, effectively "eating into their future."
4. Strategic Roadmap for Strengthening Fiscal Outlook
For the Union Government
- Energy Diplomacy: Moving toward Government-to-Government (G2G) deals with producers like Brazil, Guyana, and Russia to reduce the "risk premium" associated with West Asian conflicts.
- Capex Prioritization: Protecting the budget for high-multiplier sectors such as Semiconductors and Green Hydrogen to sustain a 7% growth trajectory.
- Monetary Coordination: Working with the RBI to stabilize the Rupee and prevent "imported inflation" from ballooning the national debt.
For State Governments
- Revenue Diversification: Reducing reliance on volatile fuel VAT by digitizing and strengthening State Excise and Stamp Duties.
- Green Energy Mandates: Shielding budgets by transitioning public transport to Electric Vehicles (EVs) and adopting solar-powered irrigation (KUSUM scheme) to lower the subsidy burden.
- Performance-Based Compliance: Focusing on property tax reforms to unlock the 20% performance-linked grants introduced by the 16th FC.
Conclusion
The 2026 fiscal outlook is a balancing act between Central resilience and Sub-national vulnerability. Long-term stability in the Indian federal structure hinges on states moving away from "consumption borrowing" toward productive capital investment. Only by adhering to the Golden Rule can states ensure that the current energy crisis does not become a permanent debt trap for future generations.
The Rise and Fall of Paytm Payments Bank: A Landmark Shift in Indian Fintech Regulation
- 26 Apr 2026
In News:
The Reserve Bank of India’s (RBI) decision to cancel the banking licence of Paytm Payments Bank Limited (PPBL), marks a watershed moment in the oversight of India’s digital finance ecosystem. This move, coming more than two years after the initial regulatory curbs, underscores the central bank's unwavering stance on governance and "Chinese wall" separation between fintech innovations and traditional banking discipline.
Understanding the Payments Bank Model
Payments banks were conceptualized as a niche banking category to drive financial inclusion by catering to low-income groups, small businesses, and the migrant labor force.
- Operational Scope: They are permitted to accept demand deposits (currently capped at ?2 lakh per customer) and offer remittance services.
- Restrictive Mandate: Unlike universal banks, they are strictly prohibited from lending or issuing credit cards.
- Safety Net: To safeguard depositors, they must invest at least 75% of their demand deposits in Government Securities (SLR-eligible) with maturities up to one year.
The Road to Cancellation: A Timeline of Scrutiny
The downfall of PPBL was not sudden but the result of a multi-year supervisory struggle regarding "persistent non-compliance."
- 2018 (Initial Red Flags): RBI audits identified critical gaps in KYC (Know Your Customer) compliance. Major violations included a single PAN being linked to thousands of accounts and transactions exceeding regulatory limits, raising severe money laundering alarms.
- March 2022: The RBI formally barred the bank from onboarding new customers.
- October 2023: A significant monetary penalty of ?5.39 crore was imposed for continued lapses.
- January–February 2024: Citing "material supervisory concerns," the RBI prohibited fresh deposits, top-ups in wallets, FASTags, and NCMC accounts.
- April 24, 2026: The final blow—the total cancellation of the banking licence and the initiation of winding-up proceedings before the High Court.
Legal Foundations of the RBI’s Action
The RBI invoked several stringent provisions of the Banking Regulation (BR) Act, 1949 to justify this unprecedented step:
- Section 22(4): Provides the power to withdraw a licence if a bank fails to meet stipulated conditions.
- Section 22(3)(c) & (e): The RBI concluded that the management’s character was prejudicial to public interest and that no "useful purpose" would be served by allowing the entity to continue.
- Section 5(b) and Section 6: These sections effectively prohibit PPBL from conducting any banking or related business with immediate effect.
A primary concern was the lack of an independent "Chinese wall" between PPBL and its parent entity, One97 Communications, which led to significant conflicts of interest and regulatory bypass.
Strategic Impact and Future Outlook
1. For the Paytm Ecosystem: One97 Communications has since moved to a "partner-bank-driven model," forging emergency alliances with entities like Axis Bank and Yes Bank to ensure that the Paytm UPI app remains functional. While the parent company is "legally ring-fenced," the cancellation complicates its path toward obtaining future licences (like an NBFC or a mobile wallet licence).
2. For the Fintech Industry: The "Paytm Case" serves as a stern warning that innovation is not a license for non-compliance. The fintech sector must now institutionalize independent compliance functions that are strictly decoupled from the aggressive growth mandates of their parent tech firms.
3. For Consumer Protection: The RBI has assured that PPBL maintains sufficient liquidity to repay all depositors in full. Most users have already migrated to rivals like PhonePe and Google Pay, but the process of winding up under High Court supervision ensures a structured exit that protects the "sanctity of the ledger."
Conclusion
This episode highlights the Security-Development Nexus in the financial sector. For a "Viksit Bharat" (Developed India), financial stability is as crucial as financial inclusion. The RBI’s action demonstrates that institutional credibility is paramount; even the most popular market players must adhere to the prudential norms that ensure the safety of the Indian banking system.
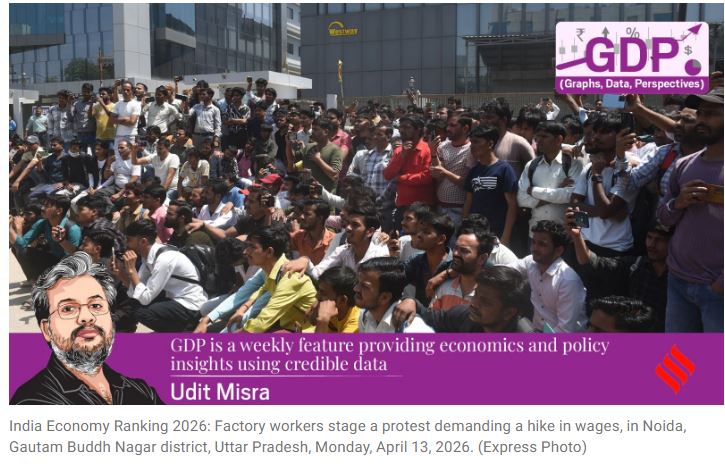
The Precarious City: Navigating the Crisis of India’s Urban Informal Workforce

- 24 Apr 2026
In News:
Recent worker protests in industrial hubs like Noida have once again brought to the fore the structural vulnerabilities of India’s informal sector. As urban centers transition from traditional industrial hubs to survival-oriented service spaces, the informal workforce—comprising nearly 90% of India’s total labor force—faces an existential crisis characterized by economic exclusion and spatial marginalization.
The Informal Sector: Scope and Economic Significance
The informal sector encompasses economic activities that function outside the ambit of formal regulatory and institutional frameworks. It is a heterogeneous mix including self-employed individuals, daily wage laborers, street vendors, and unregistered micro-enterprises.
- Dominance in Livelihood: Despite the push for formalization, the informal sector remains the backbone of the Indian economy. Even in urban landscapes, formal salaried positions are scarce, leaving the majority of migrants and residents dependent on unstable, low-paying work.
- Structural Vulnerabilities: These workers typically lack written contracts, job security, and any form of institutional social protection. This makes them the first victims of economic shocks, as seen during global pandemics or local industrial downturns.
The Urban Shift: From Production to Survival
India’s urban economic structure is undergoing a profound transformation. The decline of large-scale formal industries—symbolized by the historical closure of textile mills in Mumbai and Ahmedabad—has led to a fragmented labor market.
- The Survival Economy: Cities are increasingly becoming spaces for "social reproduction" rather than industrial production. This means the urban economy is now focused on basic survival needs like housing, food, and low-end services.
- Spatial Marginalization: Approximately 40% of the urban poor live in slums or informal settlements. These areas often lack basic sanitation and legal recognition, forcing workers into hazard-prone environments.
- The Rent Trap: A significant portion of an informal worker's income—often up to 50%—is consumed by rent in these precarious settlements. This leaves little for nutrition, health, or education.
Key Challenges and Policy Gaps
Despite its scale, the informal sector suffers from systemic neglect in urban planning and financial policy.
- Privatization of Essentials: Economic reforms have shifted the state’s role from a service provider to a market facilitator. The resulting privatization of water and electricity has increased the cost of living for those least able to afford it.
- Financial Exclusion and Debt: Lacking collateral, workers are often shunned by formal banking systems. This forces them into the clutches of local moneylenders, leading to a cycle of chronic indebtedness.
- Low Bargaining Power: The fragmented nature of urban labor prevents collective bargaining, leaving workers at the mercy of volatile market demands and predatory middle-men.
Institutional Response and Government Initiatives
The government has launched several flagship initiatives to bridge the formal-informal divide:
- Code on Social Security (2020): A legislative attempt to extend life and disability insurance, maternity benefits, and old-age protection to unorganized workers.
- e-Shram Portal: A national database of unorganized workers designed to facilitate better policy targeting and the seamless delivery of welfare benefits.
- PM SVANidhi: A micro-credit scheme providing collateral-free working capital loans to street vendors to help them resume livelihoods post-disruption.
However, challenges such as digital illiteracy, complex registration processes, and implementation bottlenecks at the local level continue to hinder the reach of these schemes.
The Way Ahead: Towards Inclusive Urban Governance
To address the precariousness of urban labor, a shift in governance philosophy is required:
- Integrating Workers into Governance: Moving beyond top-down policies, cities need inclusive structures such as workers’ councils. These platforms allow informal workers to participate in urban decision-making and advocate for their rights.
- Securing Housing and Services: Urban planning must prioritize affordable housing and protected access to essential services to reduce the "survival cost" of city life.
- Formalization with Protection: While formalizing the economy is a long-term goal, the immediate priority must be providing a "social floor"—a minimum level of social security that stays with the worker, regardless of their employment status.
Conclusion
The protests in Noida are a symptom of a deeper malaise in India’s urban growth story. A truly "Viksit Bharat" (Developed India) cannot be built on the back of an invisible and exploited informal workforce. Recognizing the informal sector not as a transient phase but as a permanent, vital part of the urban fabric is the first step toward creating resilient and inclusive cities.
The Global Economic Pecking Order: Analyzing India’s Shift to the 6th Largest Economy
- 20 Apr 2026
In News:
The global economic landscape of 2026 has witnessed a significant recalibration. According to the IMF’s World Economic Outlook 2026, India has slipped to the position of the world’s 6th largest economy. This development marks a notable shift from 2022, when India famously overtook the United Kingdom to claim the 5th spot. While the ranking shift has generated headlines, a deeper analysis reveals that the change is driven more by currency dynamics and statistical adjustments than by a fundamental loss of economic momentum.
Methodology of Global Rankings
To understand India's current position, it is essential to look at how the IMF determines global rankings. These are measured using Nominal GDP expressed in current US dollars. This calculation relies on two variables:
- Domestic GDP in local currency (the Rupee).
- Exchange Rates against the US dollar.
This methodology creates a "valuation effect." An economy might grow robustly in domestic terms, but if its currency depreciates against the dollar, its global standing in dollar terms can diminish. Conversely, if the British Pound or Japanese Yen strengthens, those nations can leapfrog others even with slower real growth.
The 2026 Economic Standings
As per the 2026 estimates, the global economic hierarchy reflects a massive gap between the "Big Two" and the rest of the world. The United States leads with a GDP exceeding $32 trillion, followed by China at approximately $20 trillion.
The subsequent tier is highly congested, with several nations clustered around the $4 trillion mark:
- Japan: $4.38 trillion
- United Kingdom: $4.27 trillion
- India: $4.15 trillion
Because these economies are so closely matched, even minor fluctuations in data or currency can trigger a "musical chairs" effect in the rankings.
Deconstructing India’s Decline: Three Primary Factors
1. Statistical Revisions and Base Year Changes: The decline was partly triggered by a downward revision of India’s GDP estimates. Following the adoption of a new base year, the government revised the 2025-26 GDP from ?357 lakh crore to ?345 lakh crore. This statistical correction indicated that previous estimates had slightly overstated the economy's size, immediately impacting the dollar conversion.
2. Currency Depreciation (The Valuation Effect): The Indian Rupee faced significant depreciation against the US dollar in 2025-26. Simultaneously, the British Pound and the Japanese Yen showed relative resilience or appreciation. This "double whammy" meant that while India’s economy grew in Rupee terms, its "dollar-denominated size" shrank relative to the UK and Japan.
3. Exchange Rate Volatility: The IMF’s reliance on nominal dollar-based comparisons makes these rankings highly sensitive to the global forex market. In a year of global financial tightening, currency movements often overshadow real production gains in the short-term ranking tables.
Strategic Future Outlook
Economists and the IMF suggest that the slip to the 6th position is a temporary statistical "re-basing" rather than a structural decline. India’s long-term fundamentals including a strong demographic dividend, infrastructure spending, and digital transformation remain intact.
- 2027 Projections: India is expected to regain the 4th largest economy spot as the effects of currency volatility stabilize.
- 2031 Projections: India is on a trajectory to become the 3rd largest economy, likely overtaking Germany, provided it maintains a consistent growth rate and manages inflationary pressures.
The New Consumer Price Index (CPI)

- 16 Apr 2026
In News:
In a significant move to align economic indicators with contemporary consumption patterns, the Ministry of Statistics and Programme Implementation (MoSPI) has transitioned to a new Consumer Price Index (CPI) series with 2024 as the base year. This revision is crucial for the Reserve Bank of India (RBI) and policymakers to accurately gauge the "cost of living" and calibrate monetary policy effectively.
I. Understanding CPI and the Need for Revision
The CPI is the primary gauge of retail inflation in India. It measures price changes in a "basket" of goods and services consumed by typical households.
- Monetary Policy Link: The RBI uses CPI for Inflation Targeting. Changes in CPI directly influence the Repo Rate, pensions, and dearness allowances.
- The Consumption Shift: As the Indian economy evolves, consumption habits move from basic necessities (like food) to discretionary items and services (like electronics and healthcare). Periodic revisions prevent the index from becoming obsolete.
II. Key Features of the 2024 Series
The transition from the previous base year (2012) to 2024 introduces several structural changes:
- Modernized Basket: Obsolete items like CDs and DVDs have been removed. They are replaced by modern essentials such as Bluetooth devices, headphones, and earphones, reflecting the digital transformation of Indian households.
- Reduced Weight of Food: Reflecting "Engel’s Law" (as income rises, the proportion of income spent on food falls), the weightage of food items has been reduced.
- Significance: Lower food weight may reduce the volatility of headline inflation, as food is highly susceptible to monsoon and supply-chain shocks.
- Revised Precious Metals Weight:
- Old Series: Gold (1.08%), Silver (0.11%).
- New Series: Gold/Diamond/Platinum jewellery (0.62%), Silver jewellery (0.31%).
- Impact: Despite the individual weight of gold decreasing, the high volatility of global bullion prices remains a significant driver of headline inflation. For instance, excluding gold and silver in December 2025 would have dropped inflation from 1.33% to a mere 0.26%.
III. Statistical Challenges: The "Apples-to-Oranges" Problem
A major hurdle in adopting a new series is the lack of direct comparability with older data.
- The Comparison Gap: January’s inflation was reported at 2.75% under the new series, while December was 1.33% under the old series. This jump is partly due to the different "baskets" being compared rather than a sudden price surge.
- The Back-Series Debate: To help economists, MoSPI released a back-series to 2013. However, experts argue this is a mechanical adjustment using linking factors rather than a reconstruction of historical data using the new consumption weights.
IV. Implications for Monetary Policy and Governance
The new series provides a more realistic lens for the RBI’s Monetary Policy Committee (MPC):
- Core Inflation Insights: With updated weights for services and non-food items, "Core Inflation" (CPI minus food and fuel) will provide a clearer picture of underlying demand.
- Better Calibration: Accurate data allows the RBI to adjust interest rates more precisely, preventing "over-tightening" or "over-easing" based on outdated consumption data.
- Welfare Schemes: Real-time inflation data ensures that government subsidies and wage adjustments (like MGNREGA wages) stay in sync with the actual cost of living.
From Borrowers to Builders: The Evolution of Women in India’s Credit Market
- 11 Apr 2026
In News:
In a landmark development for financial inclusion and women-led development, NITI Aayog released the second edition of its comprehensive report, "From Borrowers to Builders: Women and India’s Evolving Credit Market”. Prepared under the aegis of the Women Entrepreneurship Platform (WEP) in collaboration with TransUnion CIBIL and MicroSave Consulting (MSC), the report highlights a structural shift where women are transitioning from mere recipients of credit to significant drivers of India's entrepreneurial economy.
Key Highlights: The Quantitative Shift
The report presents a compelling narrative of growth in women's participation in formal credit systems between 2017 and 2025.
- Portfolio Growth: Women borrowers now hold a credit portfolio of ?76 lakh crore, accounting for 26% of the total system credit. This represents a staggering 4.8-fold increase from ?16 lakh crore in 2017.
- Expansion in Business Lending: While retail loans remain dominant, business-purpose loans for women have surged 7.5 times since 2017, now constituting 25% of their total credit value.
- Credit Penetration: The percentage of credit-active women has nearly doubled, rising from 19% to 36%, representing approximately 16 crore (160 million) active women borrowers.
- Regional Trends: While the South and West remain leaders, Northern states like Bihar and Uttar Pradesh are emerging as high-growth markets, recording business loan Compound Annual Growth Rates (CAGRs) of 59% and 42%, respectively.
- Superior Credit Behavior: The report underscores that women are highly reliable borrowers, with default rates 30% lower than the general market average.
The Role of Digital Public Infrastructure (DPI)
The convergence of DPI—including UPI, e-KYC, and digital identity systems—has been a primary catalyst in reducing entry barriers.
- Speed of Credit: Same-day approvals for consumption loans rose from 34% in 2022 to 45% in 2025.
- Digital Adoption: Among Rural Women Nano-Entrepreneurs (RWNEs), 60–70% now use digital payments, creating a "verifiable cash-flow history" that can be used for credit underwriting.
Challenges to Financial Autonomy
Despite the progress, several structural and behavioral barriers persist:
- Time Poverty: Women face significant "time poverty" due to unpaid care and household responsibilities, limiting their ability to engage consistently with financial tools.
- Shared Resources: The use of shared mobile devices in rural households often constrains independent and private financial decision-making.
- Limited Strategic Control: Many women manage daily business operations but lack final authority over large-scale strategic investments or procurement.
- Microfinance Contraction: The MFI sector has seen a contraction in supply due to rising Non-Performing Assets (NPAs) and concerns over borrower over-indebtedness.
- Complexity Gap: Access to sophisticated products like Cash Credit (CC) and Overdraft (OD) facilities remains low, utilized by only ~4.3% of women-owned entities.
Recommendations for Sustainable Growth
To transition from inclusion to "progression-led participation," the report offers several strategic interventions:
- Flow-Based Underwriting: Lenders should move away from collateral-heavy models toward using UPI transaction data and digital footprints to assess risk for first-time borrowers.
- Gender-Intelligent Products: Designing credit products with flexible repayment schedules that align specifically with the cash-flow cycles of women-led small businesses.
- Project Seher: Expanding credit education programs to improve financial literacy and help women understand the long-term value of their credit scores.
- Leveraging SHGs: Utilizing Self-Help Groups (SHGs) as "trust bridges" to introduce new financial technologies and digital tools.
- End-to-End Digitization: Reducing Turnaround Time (TAT) for secured loans (like housing) by digitizing property valuation and collateral checks.
India’s Defence Export Surge

- 05 Apr 2026
In News:
India’s defence sector has achieved a historic milestone in the financial year 2025-26, with defence exports reaching an all-time high of ?38,424 crore. This represents a staggering 62.66% increase over the previous fiscal year (?23,622 crore). This surge is a testament to India's transition from being one of the world's largest arms importers to an emerging global exporter, driven by the vision of Atmanirbhar Bharat (Self-Reliant India).
Key Highlights of FY 2025-26
The growth in exports is characterized by a robust partnership between the public and private sectors:
- Sectoral Contribution: Defence Public Sector Undertakings (DPSUs) contributed 54.84% (?21,071 crore), while the private sector accounted for 45.16% (?17,353 crore).
- Surging Growth: DPSU exports skyrocketed by 151%, while private firms maintained steady growth with a 14% increase.
- Global Footprint: India now exports defence equipment to more than 80 countries. The number of active exporters has grown to 145, reflecting a more competitive and wider industrial base.
- Budgetary Support: The defence budget has grown significantly to ?6.81 lakh crore in 2025-26, providing the necessary capital for modernization and indigenous production.
Major Exported Products and Destinations
India's export basket has expanded from components to full-scale advanced platforms:
- Key Products: BrahMos Supersonic Cruise Missiles, Akash Surface-to-Air Missile systems, Pinaka Multi-Barrel Rocket Launchers, Advanced Towed Artillery Gun System (ATAGS), Dornier-228 aircraft, and Zen Anti-Drone Systems.
- Top Buyers:
- Components/Sub-systems: United States, France, and Israel (primarily for aero-structures and electronics).
- Indigenous Weapon Systems:Armenia (Akash, Pinaka, ATAGS) and the Philippines (BrahMos).
- Others: UAE, South Korea, Italy, and various nations across Africa and Southeast Asia.
The Strategic Imperative for Indigenisation
The push for domestic manufacturing is rooted in the need for Strategic Autonomy:
- National Security: Reducing dependence on foreign OEMs ensures that supply chains are not disrupted during geopolitical crises or through technology denials (sanctions).
- Economic Efficiency: Indigenous production conserves foreign exchange and creates a "waste-to-wealth" cycle within the domestic economy.
- Tailored Technology: Platforms can be customized for India’s unique terrains—ranging from high-altitude Himalayan regions to tropical maritime zones.
- Technological Sovereignty: Owning the Intellectual Property (IP) allows India to upgrade and modify systems without seeking external permissions.
Key Reforms Driving the Transformation
The Government of India has introduced several structural reforms to facilitate this growth:
- DAP 2020 & IDDM: The Defence Acquisition Procedure (DAP) 2020 prioritizes the Indian-IDDM (Indigenously Designed, Developed, and Manufactured) category as the highest preference for procurement.
- Simplified ‘Make’ Procedures:
- Make-I: Government-funded (up to 70%) development of complex systems.
- Make-II: Industry-funded prototypes with simplified paperwork and fast-track approvals.
- FDI Liberalization: Automatic route for Foreign Direct Investment increased to 74%, and up to 100% via government approval for niche technologies.
- Innovation Ecosystems:
- iDEX (Innovations for Defence Excellence): Grants for startups and MSMEs.
- Technology Development Fund (TDF): Funding up to ?10 crore for R&D in critical technologies.
- Defence Industrial Corridors (DICs): Established in Uttar Pradesh and Tamil Nadu, these hubs have attracted over ?9,145 crore in investment and signed nearly 290 MoUs to build a localized supply chain.
Roadmap to 2029: The Global Hub Vision
The Ministry of Defence has set ambitious targets for the near future:
- Production Target: Reach ?3 lakh crore in annual domestic defence production by 2029.
- Export Target: Aim for ?50,000 crore in annual exports by 2029.
- MSME Integration: Engaging over 16,000 MSMEs to ensure a resilient and tiered manufacturing ecosystem.
Energy Statistics India 2026
- 03 Apr 2026
In News:
The Ministry of Statistics and Programme Implementation (MoSPI) has released its annual publication, “Energy Statistics India 2026.” This comprehensive dataset integrates information on India’s energy reserves, production, consumption, and trade, providing a pulse check on the nation's energy security and transition trajectory as of March 31, 2025.
Macro-Economic Energy Indicators
During the Financial Year 2024-25, India’s energy sector mirrored the nation’s robust economic growth.
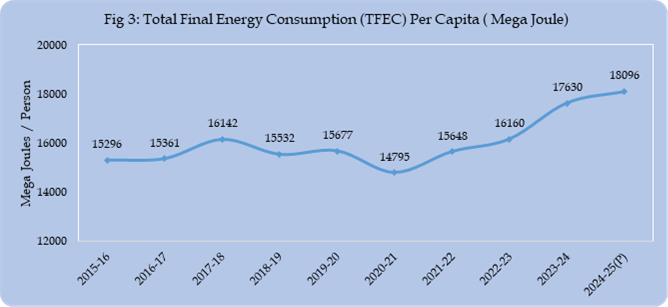
- Primary Energy Supply: The Total Primary Energy Supply (TPES) registered a healthy expansion of 2.95% over the previous year.
- Per-Capita Consumption: Reflecting rising living standards and industrialization, per-capita energy consumption has grown at a Compound Annual Growth Rate (CAGR) of 1.89% over the decade spanning 2015-16 to 2024-25.
- Credit Flow: Financial confidence in the sector has skyrocketed. Investment flows surged from ?1,688 crore in 2021 to ?10,325 crore in 2025, a more than six-fold increase in just four years.
The Renewable Energy Paradigm
India’s renewable energy (RE) sector is the cornerstone of its climate strategy, showing both immense potential and rapid adoption.
- Total Potential: As of March 2025, India’s estimated renewable energy potential stands at a staggering 47,04,043 MW.
- Resource Composition:Solar energy is the dominant pillar, accounting for nearly 71% of this potential. This is followed significantly by wind power and large hydro projects.
- Geographic Concentration: A critical administrative challenge is the spatial distribution of these resources. Over 70% of India's RE potential is clustered in just six states: Rajasthan, Maharashtra, Gujarat, Andhra Pradesh, Karnataka, and Madhya Pradesh.
- Generation Growth: Actual electricity generation from renewable sources (Utility and Non-Utility) has witnessed a robust CAGR of 9.17%, outpacing conventional growth rates.
Continued Reliance on Fossil Fuels
Despite the green surge, the report highlights a persistent structural reality: Coal remains the dominant source of energy, contributing the highest share to the total primary energy supply. This underscores the "Energy Trilemma" India facesbalancing energy security, energy equity, and environmental sustainability.
Key Takeaways for Policy Analysis
- Demand Dynamics: The steady rise in demand reflects sustained economic growth, but it also necessitates a concurrent expansion in generation capacity to prevent supply deficits.
- Infrastructure Imperatives: The geographic concentration of RE in western and southern states creates an urgent need for the Green Energy Corridor and enhanced interstate transmission networks to prevent regional energy imbalances.
- Transition Challenges: The dominance of coal indicates that while the "addition" of green energy is fast, the "replacement" of fossil fuels is a long-term structural challenge.
- Investment Climate: The massive growth in credit flow suggests that policy frameworks like the Production Linked Incentive (PLI) for solar modules and sovereign green bonds are successfully building investor trust.
Fiscal Federalism in India and the Debate over the 41% Tax Devolution
- 12 Mar 2026
In News:
The debate on fiscal federalism in India has intensified following the Union government’s acceptance of the 41% tax devolution recommended by the Sixteenth Finance Commission. While the recommendation appears to maintain the existing share of tax revenues for States, critics argue that structural changes in the fiscal framework may gradually reshape the balance of financial power between the Centre and the States.
Fiscal Federalism in India
Fiscal federalism refers to the division of financial powers, taxation authority, and expenditure responsibilities between different levels of government in a federal system. In India, the Constitution establishes a structured framework for fiscal relations between the Union and the States.
Key constitutional provisions include:
- Articles 268–281: These articles govern the distribution of taxation powers and revenue sharing between the Union and the States.
- Article 280: Provides for the establishment of the Finance Commission, which recommends the sharing of central taxes and grants to States.
- Seventh Schedule: Divides taxation powers between the Union List and the State List.
Since the Union government collects a major share of taxes, the Finance Commission periodically recommends how the divisible pool of central taxes should be distributed among States.
Evolution of Tax Devolution
The share of States in the divisible pool has increased over time:
- 14th Finance Commission: Increased States’ share to 42%.
- 15th Finance Commission: Reduced it slightly to 41% after the reorganisation of Jammu and Kashmir.
- 16th Finance Commission: Recommended retaining the 41% share.
Although the percentage has remained unchanged, analysts argue that the effective transfer of resources to States may be declining.
The Divisible Pool and the Issue of Cesses and Surcharges
The divisible pool represents the portion of central tax revenues that is shared with States. However, certain revenues such as cesses and surcharges are excluded from this pool and are retained entirely by the Union government.
Over time, the share of the divisible pool in gross tax revenue has declined:
- 13th Finance Commission period: 89.2%
- 14th Finance Commission period: 82.1%
- 15th Finance Commission period: 78.3%
This trend implies that even though the States’ share is fixed at 41%, the base from which this percentage is calculated has shrunk, reducing the overall transfer to States.
Key Recommendations of the Sixteenth Finance Commission
The Union government accepted several major recommendations of the Commission, including:
- Retaining 41% tax devolution to States
- Acceptance of the horizontal distribution formula among States
- Approval of grants to local bodies
- Continuation of the disaster management funding framework
However, several structural reforms proposed by the Commission were deferred. These include:
- Reform of Fiscal Responsibility Legislation (FRL) frameworks
- Regulation of off-budget borrowings by States
- Reforms in the power sector distribution companies (DISCOMs)
- Rationalisation of subsidies
Fiscal Stress in States
The Commission also highlighted rising fiscal stress in several States. For example:
- Punjab: Debt–GSDP ratio of 42.9% and revenue deficit of 3.7% of GSDP (2023–24).
- Rajasthan: Liabilities at 37.9% of GSDP.
- West Bengal: Liabilities at 38.3% of GSDP.
- Andhra Pradesh: Liabilities around 34.6% of GSDP.
In some cases, borrowing is used primarily to finance revenue expenditure such as salaries and interest payments, rather than capital investment. Another concern is off-budget borrowing, where loans are raised through government-controlled entities and serviced using public funds.
Changes in Horizontal Devolution
The Finance Commission also revised the horizontal distribution formula among States. Earlier, a criterion known as tax and fiscal effort rewarded States that improved their tax collection efficiency. This has now been replaced with a “contribution to GDP” indicator with a weight of 10%.
This shift may benefit economically stronger States such as Maharashtra, Gujarat, and Karnataka, which contribute significantly to national GDP. However, poorer States such as Bihar, Jharkhand, and Uttar Pradesh, which depend heavily on central transfers, may gain relatively less, raising concerns about weakening the principle of fiscal equalisation.
Local Body Grants
The Sixteenth Finance Commission also recommended ?7,91,493 crore in grants for rural and urban local bodies. These grants are divided into:
- Basic grants for essential services and administration.
- Performance grants linked to conditions such as timely constitution of State Finance Commissions, audited accounts, and compliance with data reporting systems.
However, implementation challenges persist, as only 62.6% of recommended urban local body grants were released during the previous Finance Commission period.
Conclusion
The retention of 41% tax devolution appears to preserve the formal structure of fiscal federalism. However, the increasing use of cesses and surcharges, changes in allocation criteria, and delays in structural reforms indicate evolving Centre–State fiscal dynamics. These developments may gradually reshape India’s fiscal federal landscape, raising important questions about resource distribution, fiscal autonomy, and cooperative federalism.
India’s New GDP Series (Base Year 2022–23): A Major Statistical Reform
- 27 Feb 2026
In News:
The Ministry of Statistics and Programme Implementation (MoSPI) is releasing a new series of National Accounts Statistics (NAS) with 2022–23 as the base year, replacing the 2011–12 base year. The revised series aims to improve the accuracy and granularity of estimates of Gross Domestic Product (GDP) and Gross Value Added (GVA), reflecting structural changes in the Indian economy over the past decade.
Rationale for Revision
Since the previous base year revision in 2015, India’s economy has undergone significant transformations:
- Expansion of the digital economy and e-commerce
- Increased formalisation following the GST regime
- Shifts in consumption, employment, and production patterns
- Rapid growth of financial and service sectors
Updating the base year ensures better measurement of real growth, improved sectoral representation, and stronger evidence-based policymaking.
Key Structural Improvements
1. Sectoral Measurement Reforms
- Private Corporate Sector: Earlier, a company’s entire GVA was attributed to its dominant sector. The new approach allocates GVA based on activity-wise revenue shares, improving sectoral accuracy.
- General Government Sector: Inclusion of housing services provided to government employees and better coverage of local bodies and autonomous institutions enhances government output estimation.
2. Better Estimation of the Household Sector
The household sector—one of India’s largest contributors to GVA—will now be estimated using annual data from:
- Annual Survey of Unincorporated Sector Enterprises (ASUSE)
- Periodic Labour Force Survey (PLFS)
This replaces earlier extrapolation methods with direct annual estimation.
3. Improved Consumption Estimates
Private Final Consumption Expenditure (PFCE) will be derived from:
- Household Consumer Expenditure Surveys
- Production-side data
- Administrative datasets
This strengthens measurement of domestic demand.
Integration of Administrative Data
- Expanded use of GST data for regional output estimation and corporate value addition.
- Identification of active companies through tax records.
- Use of RBI’s Statistical Tables Relating to Banks in India (STRBI) for banking sector estimates.
- Replacement of proxy methods for private NBFCs with actual financial data from the Ministry of Corporate Affairs.
These changes improve financial sector GVA estimation and reduce reliance on assumptions.
Informal Sector and Agriculture
Greater use of ASUSE improves coverage of informal enterprises, insurance agents, and Gross Fixed Capital Formation (GFCF) in the unincorporated sector.
Agriculture estimation is strengthened using updated methodologies and data from institutions such as:
- Central Marine Fisheries Research Institute
- Central Inland Fisheries Research Institute
- Grassland and Fodder research bodies
This improves measurement of livestock, fisheries, and fodder output.
Methodological Upgrade: Double Deflation
One of the most significant reforms is the shift from a single deflator to a double deflator method.
- Earlier: Same inflation rate applied to inputs and outputs, causing growth distortions.
- Now: Separate deflators for inputs and outputs, ensuring more accurate real GVA estimates.
This reduces statistical discrepancies and improves credibility.
Additionally, Supply and Use Tables (SUTs) will be integrated, improving consistency between production and expenditure approaches.
International Alignment
India currently follows the System of National Accounts (SNA 2008). With the UN adopting SNA 2025, India plans to align with updated global standards in future revisions.
Challenges
- Complexity of double deflation and data integration.
- Back-series reconstruction may take nearly a year.
- State-level data quality variations.
- Need for greater transparency to avoid credibility debates seen in past revisions.
Conclusion
The 2022–23 base year revision represents one of India’s most comprehensive statistical overhauls in over a decade. By integrating richer datasets, modern methodologies, and improved sectoral coverage, the new GDP series aims to enhance policy reliability and international comparability. Its success, however, will depend on transparent implementation, timely back-series release, and sustained strengthening of India’s statistical ecosystem.
India’s Aviation Sector: The Case for Data-Driven Oversight

- 20 Feb 2026
In News:
India’s aviation sector has emerged as one of the fastest-growing in the world, marked by rising passenger traffic, expansion of low-cost carriers, and rapid airport infrastructure development across metros and tier-2 cities. However, regulatory mechanisms have not kept pace with this expansion.
The growing complexity of algorithm-based pricing and market concentration makes a strong case for data-driven oversight, moving beyond reactive crisis management to proactive, evidence-based regulation.
Structural Transformation of India’s Aviation
- Rapid rise in domestic air travel.
- Dominance of low-cost carriers.
- Expansion of airport infrastructure under public-private partnerships.
- Increasing use of dynamic revenue management systems for pricing.
While operational data on passenger numbers, fleet size, and freight movement is regularly tracked, systematic monitoring of fare behaviour and market conduct remains limited.
Why Data-Driven Oversight is Needed
1. Dynamic Pricing and Algorithmic Markets
Airline fares fluctuate in real time based on:
- Demand patterns
- Seat inventory
- Competitor pricing
- Seasonal variation
- Route-level market share
This makes it difficult to distinguish between legitimate demand-driven price increases and potential market power abuse.
2. Limits of Crisis-Based Regulation
Recent fare spikes in India have triggered:
- Temporary fare caps
- Requests for data submission
- Post-facto investigations
However, ad hoc interventions are reactive and do not substitute for continuous, structured oversight. Often, data collected is retrospective and insufficient for robust analysis.
3. Volume-Focused Oversight
Current regulatory practice largely tracks traffic volumes rather than pricing behaviour. In a market increasingly driven by algorithmic decision-making, this creates regulatory blind spots.
Importance of Data Transparency
(a) Identifying Route-Level Market Power
If routes dominated by a single airline consistently show higher fares compared to competitive routes, it may signal structural pricing power.
(b) Tracking Entry and Exit Effects
- Entry of a new airline → Fares usually decline.
- Exit of a competitor → Fares often increase.
Systematic data collection enables regulators to measure competitive intensity.
(c) Monitoring Peak-Period Pricing
Holiday seasons provide natural tests of pricing conduct. Disproportionate fare increases on routes with high market share may indicate dominance leverage.
(d) Algorithmic Accountability
When pricing outcomes are observable and periodically reviewed, airlines are incentivised to embed compliance safeguards within revenue management systems. Transparency acts as a deterrent without constant state intervention.
Global Best Practice: The U.S. DB1B Model
The United States’ Airline Origin and Destination Survey (DB1B), maintained by the Bureau of Transportation Statistics (BTS), provides a model for structured transparency.
- Collects ticket-level data since 1995.
- Covers a 10% random sample of domestic tickets each quarter.
- Tracks fares, routes, and carrier details.
The DB1B database enables:
- Long-term pricing trend analysis
- Competition assessment
- Empirical research
- Transparent policymaking
Adopting a similar 10% sampling framework in India could expand the role of the Directorate General of Civil Aviation (DGCA) from volume tracking to behaviour monitoring.
Addressing Industry Concerns
- Proprietary Algorithms: A sampling framework monitors outcomes, not algorithmic code.
- Technical Burden: Airlines already maintain digital databases; quarterly reporting is feasible.
- Risk of Implicit Coordination: Delayed and aggregated release of data can prevent real-time collusion risks.
Way Forward
- Institutionalise periodic, structured fare data collection.
- Build analytical capacity within regulatory bodies.
- Shift from temporary fare caps to continuous oversight.
- Promote competition while safeguarding consumer interests.
- Strengthen inter-agency coordination between aviation and competition authorities.
Conclusion
India’s aviation growth is a major economic achievement. However, rapid expansion without robust data infrastructure risks regulatory vulnerabilities. The solution lies not in heavy-handed control but in structured transparency and analytical regulation.
In an increasingly algorithm-driven aviation market, regulatory institutions must evolve toward data-centric governance to ensure fair competition, consumer protection, and sustainable sectoral growth.
Revising India’s GDP Framework

- 21 Dec 2025
In News:
India is undertaking a significant overhaul of its Gross Domestic Product (GDP) estimation framework as part of the revision of the national accounts series with a new base year of 2022–23. The reform, led by the Ministry of Statistics and Programme Implementation (MoSPI), proposes the elimination of the long-debated ‘discrepancies’ component from GDP estimates. The new GDP series is scheduled for release on 27 February 2026, while the revised back series is expected by February 2027.
Understanding ‘Discrepancies’ in GDP Estimation
GDP in India is compiled using two parallel approaches: the production (or income) approach and the expenditure approach. In theory, both should yield the same aggregate GDP. In practice, however, differences in data sources, coverage, valuation methods, and time lags lead to mismatches between the two estimates. This gap is recorded as ‘discrepancies’ under the expenditure-side GDP, which is conventionally considered less reliable than the production-side estimate.
A positive discrepancy indicates that production-side GDP exceeds expenditure-side GDP, while a negative discrepancy implies the opposite. These discrepancies have become increasingly volatile in recent years, particularly in the post-pandemic period.
Why Discrepancies Are a Concern
Large and fluctuating discrepancies obscure the true drivers of economic growth and complicate macroeconomic analysis. They also raise the likelihood of substantial future revisions in GDP growth rates, undermining confidence among policymakers, investors, and analysts.
For instance, in the July–September quarter, when real GDP growth was reported at 8.2%, discrepancies amounted to ?1.63 lakh crore, or 3.3% of GDP in real terms. In nominal terms, the discrepancy was –?2.46 lakh crore (–2.9% of GDP). Similar sharp swings were observed earlier, from –3% of GDP in January–March 2023 to 3.3% in April–June 2023.
The Proposed Reform: Integrating Supply and Use Tables
To address this issue, MoSPI plans to integrate Supply and Use Tables (SUTs) with the compilation of annual national accounts. SUTs map the supply of goods and servicesthrough domestic production and imports—against their uses, such as intermediate consumption, final consumption, capital formation, and exports. A key accounting constraint is that total supply must equal total use for each product.
By aligning GDP estimates with SUTs and the principles of the System of National Accounts (SNA), discrepancies are expected to be minimized in early estimates and eliminated entirely in final estimates once comprehensive data becomes available.
Expert Views and Persistent Challenges
Economists have broadly welcomed the move, noting that persistent discrepancies in past GDP revisions have weakened interpretability of growth trends. However, concerns remain regarding data quality, particularly the continued reliance on outdated survey data, in some cases more than a decade old. The complexity of estimating GDP in a large, diverse, and informal economy like India further compounds the challenge.
Additional issues include time lags in data availability, uneven quality of administrative records, and the risk that eliminating discrepancies may involve judgement-based adjustments, potentially affecting transparency.
Way Forward and Conclusion
For the reform to succeed, India must strengthen institutional capacity for national accounts compilation, regularly update surveys, especially in services and informal sectorsand enhance real-time administrative data systems. Methodological transparency and close alignment with international best practices under the SNA will be critical.
Overall, the proposed removal of ‘discrepancies’ represents a structural improvement in India’s GDP framework, promising cleaner, more consistent, and policy-relevant growth estimates—provided it is underpinned by robust data and transparent statistical practices.
Union Budget 2026–27: Charting India’s Path to Growth, Inclusion and Resilience
- 04 Feb 2026
In News:
The Union Budget 2026–27 was presented in Parliament by the Nirmala Sitharaman, marking her ninth consecutive Budget and the first to be prepared in Kartavya Bhawan. The fiscal blueprint is structured around three core duties or “Kartavyas” that reflect the government’s strategic priorities: accelerating and sustaining economic growth, building human capacities and fulfilling aspirations, and ensuring inclusive development across regions and communities. This framework signals an integrated approach to achieve Viksit Bharat by 2047 amid global uncertainties and domestic structural challenges.
Macro-Fiscal Framework and Priorities
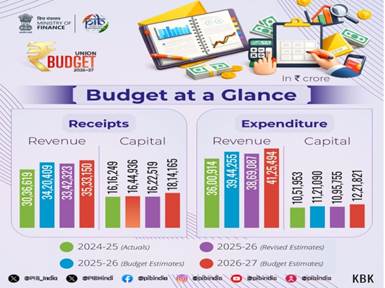
For the financial year 2026–27, the Budget projects total expenditure at ?53.5 lakh crore, with non-debt receipts estimated at ?36.5 lakh crore and net tax receipts at ?28.7 lakh crore. The fiscal deficit is targeted at 4.3% of GDP, marginally lower than the revised estimate of 4.4% for 2025–26, underscoring a continued commitment to fiscal consolidation. The debt-to-GDP ratio is projected to decline to 55.6%, indicating gradual improvement in fiscal metrics.
First Kartavya: Growth, Competitiveness and Infrastructure
The Budget places strong emphasis on strengthening India’s growth engine through investment-led strategies and sector-specific interventions. Public capital expenditure is significantly enhanced to ?12.2 lakh crore, reinforcing the infrastructure build-out across transport, logistics, waterways and urban connectivity. Seven high-speed rail corridors are proposed as growth connectors, while 20 new national waterways are slated to be operational in the coming five years.
Manufacturing and strategic sectors receive focused support. The Biopharma SHAKTI initiative, with an outlay of ?10,000 crore, aims to position India as a global biopharmaceutical hub. The India Semiconductor Mission 2.0 and expanded electronics components manufacturing scheme are designed to enhance technological sovereignty and supply chain resilience. Rare earth corridors in mineral-rich states will facilitate mining, processing and value chain development. Initiatives such as the Textile Expansion and Employment Scheme and Mega Textile Parks will boost traditional and technical textiles through cluster-based financing and technology upgradation.
Special focus is accorded to legacy industry revival, with targeted schemes to modernise 200 industrial clusters, and to developing Champion SMEs backed by a ?10,000 crore growth fund. Infrastructure risk mitigation funds and monetisation of CPSE real estate are expected to catalyse private investment.
Second Kartavya: Human Capital and Aspirational Growth
The second Kartavya underscores investment in human capital. A High-Powered Education–Employment–Enterprise Standing Committee will align skill development with employment outcomes, particularly in services and future sectors. New allied health institutions and regional medical hubs are proposed to strengthen healthcare capacity and position India as a medical tourism destination. Traditional systems of medicine will be reinforced with new institutes for Ayurveda.
Education infrastructure will be expanded with university townships near industrial corridors and girls’ hostels across districts to improve access and equity. Creative industries under the Orange Economy will be catalysed through AVGC labs in schools and colleges, targeting employment generation in animation, gaming and visual effects.
Third Kartavya: Inclusive Development and Last-Mile Participation
Inclusivity is central to the third Kartavya. Major schemes are unveiled to boost farm incomes, including integrated development of reservoirs, a Coconut Promotion Scheme and Bharat-VISTAAR, an AI-enabled multilingual platform to improve agricultural decision-making. Efforts to empower divyangjan through skilling initiatives and the expansion of mental health infrastructure, including NIMHANS-2, reflect a broader social inclusion agenda.
Regional disparities are addressed through targeted infrastructure in Purvodaya States and the North-East, including tourism circuits and e-buses to enhance sustainable connectivity. Fiscal transfers through the 16th Finance Commission amount to ?1.4 lakh crore, reinforcing cooperative federalism.
Conclusion
The Union Budget 2026–27 balances growth imperatives with inclusive outcomes, reinforcing infrastructure, manufacturing, human capital, and regional equity. Anchored in the Three Kartavyas, it strives to consolidate India’s macroeconomic stability while enabling citizens to actively participate in and benefit from the development process.
RBI’s “Goldilocks Phase” and Repo Rate Cut

- 11 Dec 2025
In News:
The Monetary Policy Committee (MPC) of the Reserve Bank of India (RBI) reduced the repo rate by 25 basis points (bps) to 5.25%, taking total rate cuts in 2025 to 125 bps. The RBI described current macroeconomic conditions as a “Goldilocks phase”a rare combination of low inflation and strong growth.
What is a Goldilocks Phase?
A Goldilocks economy refers to a situation where:
- Economic growth is strong but not overheating
- Inflation is low and stable, without risk of deflation
It represents an ideal macroeconomic balance where demand is healthy, supply constraints are manageable, and price stability allows supportive monetary policy.
India’s Current Indicators (2025–26):
- GDP growth: 8.2% in Q2 (July–September)
- CPI inflation: 1.7% average in Q2, falling to 0.3% in October
- Inflation fell below the RBI’s lower tolerance band (2%) for the first time under the Flexible Inflation Targeting (FIT) framework
Repo Rate – Key Concept
The repo rate is the interest rate at which commercial banks borrow short-term funds from the RBI by selling securities with an agreement to repurchase them later.
Policy Role:
- Higher repo rate → Costlier loans → Slower demand → Controls inflation
- Lower repo rate → Cheaper loans → Higher borrowing → Boosts growth
It is the primary tool of monetary policy transmission.
Flexible Inflation Targeting (FIT) in India
India follows a Flexible Inflation Targeting regime.
- Target: 4% CPI inflation
- Tolerance Band: ±2% (2% to 6%)
- Inflation control is the primary mandate, but RBI retains flexibility to support growth in the short term.
The current disinflation has given RBI policy space to prioritize growth.
Why Did RBI Cut the Repo Rate?
1. Sustained Disinflation: Inflation dropped sharply and persistently, even breaching the lower band of 2%. This reduced concerns about price instability.
2. Strong Growth Momentum: Robust GDP growth created a cushion, allowing rate cuts to prolong the expansion without overheating.
3. Countering Global Headwinds: Global trade slowdown, geopolitical tensions, and financial volatility threaten exports and investment. Lower rates support domestic demand.
4. Policy Consistency: Just as RBI tightens when inflation is persistently high, it eases when inflation remains too low—aligning with the FIT framework.
RBI’s Evolving Currency Approach
Despite the rupee weakening past ?90 per US dollar, the RBI has shown greater tolerance for currency flexibility, intervening only to curb excess volatility, not defend specific levels. This reflects a shift toward a more market-determined exchange rate regime.
Likely Economic Implications
Growth Boost: Lower borrowing costs encourage:
- Household consumption
- Business investment
- Credit expansion
Inflation Risks: Higher liquidity may later create demand-pull inflation, but RBI expects inflation to remain within the 2–6% band.
External Sector Effects
- Weaker rupee may improve export competitiveness
- Imports may become costlier, widening trade deficit
Impact on Savers: Lower acknowledges:
- Reduced returns on deposits and savings instruments
Forward Outlook
RBI has indicated that:
- Growth may moderate in the second half of the year
- Inflation forecasts have been revised downward
- Further measured easing remains possible if disinflation persists
However, risks remain from:
- Global economic slowdown
- Trade disruptions and tariffs
- Geopolitical instability
The current Goldilocks phase offers a policy window, but sustaining it requires balancing growth support with vigilance against future inflationary pressures.
Circular Economy in India’s Dairy Sector
- 10 Dec 2025
In News:
The concept of a circular economy (CE) is gaining policy attention in India as a sustainable alternative to the traditional linear model of “take–make–dispose.” In the dairy sector, this approach is emerging as a transformative model that links farmer income enhancement, environmental sustainability, and rural industrialisation. Recent initiatives such as Banas Dairy’s bio-CNG and organic fertiliser plant in Gujarat highlight how circular principles can significantly improve livelihoods, with projections suggesting up to a 20% rise in farmers’ income over the next five years.
Understanding the Circular Economy
A circular economy is designed to minimise waste and maximise resource efficiency by keeping materials in productive use for as long as possible. It emphasisesreuse, recycling, refurbishing, and regeneration of natural systems, in contrast to the linear system that depletes resources and generates waste. In agriculture and dairy, CE integrates biological cycles, ensuring that by-products return to the soil or energy system rather than becoming pollutants.
India has already incorporated CE principles through initiatives like the Vehicle Scrappage Policy, Swachh Bharat Mission, Mission LiFE, and promotion of waste-to-wealth projects. The dairy sector now represents a critical frontier for applying this framework at scale.
Circular Model in the Dairy Sector
India is the world’s largest milk producer, yet the sector has historically focused only on milk procurement and processing. The circular model broadens this vision to include value recovery from dairy waste and diversification of products.
A key example is the conversion of cattle dung into biogas (bio-CNG) and organic fertiliser. This creates multiple benefits:
- Additional income streams for farmers
- Reduced dependence on chemical fertilisers
- Lower reliance on fossil fuels
- Improved soil health and energy security
Beyond waste-to-energy, CE encourages diversification into value-added dairy products such as milk powder, specialty cheeses, and nutraceuticals. This aligns with global demand trends and can boost exports, MSME participation, and rural supply chains.
Even by-products like hides from naturally deceased cattle can be ethically utilised within cooperative frameworks, preventing waste and generating supplementary income.
Banas Dairy as a Model of Circular Integration
Banas Dairy in Gujarat, one of Asia’s largest dairy cooperatives, exemplifies this integrated approach. With a large-scale bio-CNG plant, fertiliser production units, and expanded milk-processing infrastructure, it demonstrates how cooperatives can function as multi-product, zero-waste ecosystems. Its success is being positioned as a model for replication across India under the vision of White Revolution 2.0.
Role of Cooperatives and Women
The cooperative model is central to CE adoption in dairy. Institutional support through the Ministry of Cooperation, affordable credit, and technology access is crucial. Importantly, women dairy farmers play a pivotal role, with direct income transfers enhancing financial inclusion and women-led development.
Challenges
Despite its promise, scaling the circular dairy economy faces challenges:
- High initial capital costs for biogas and processing plants
- Technological gaps in small dairies
- Need for training and skill development
- Inadequate cold chain and logistics infrastructure
- Regulatory oversight for ethical by-product utilisation
Way Forward
To realise its potential, India must provide targeted financial support (NABARD, cooperative banks), promote skill training, strengthen export linkages via APEDA, and expand cold chain networks through PPPs. Policy convergence with Atmanirbhar Bharat, Doubling Farmers’ Income, and climate commitments will further accelerate adoption.
Conclusion
The circular economy in the dairy sector represents a structural shift from subsistence to sustainability. By converting waste into wealth, promoting value addition, and strengthening cooperatives, India can simultaneously achieve rural prosperity, environmental resilience, and global competitiveness in the dairy economy.
Union Budget 2026–27: Growth, Inclusion and Structural Transformation
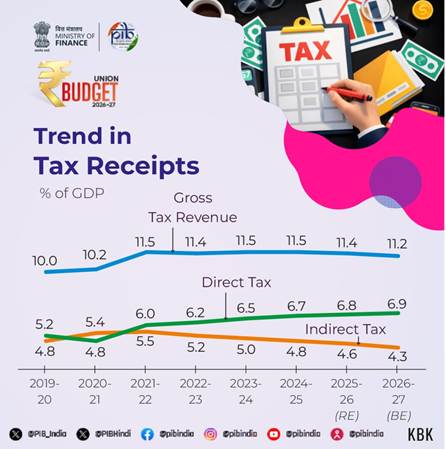
- 02 Feb 2026
In News:
The Union Budget 2026–27 is anchored in a threefold developmental framework accelerating economic growth, building human capacity, and ensuring inclusive participation. At a time when the global economy faces supply chain realignments, technological disruption, and resource insecurity, the Budget attempts to position India as a resilient, innovation-driven, and socially inclusive economy.
I. Growth Strategy: Investment-Led and Technology-Driven
A defining feature of the Budget is the continued emphasis on public capital expenditure, raised to ?12.2 lakh crore. This reinforces the government’s belief that infrastructure spending crowds in private investment, enhances productivity, and generates employment.
The push spans:
- High-speed rail corridors and freight infrastructure
- Expansion of National Waterways for cost-effective logistics
- Development of City Economic Regions (CERs) to leverage urban agglomeration benefits
These measures reflect a shift from isolated project-based development to integrated regional growth planning.
The Budget also promotes strategic manufacturing and high-technology sectors. The Biopharma SHAKTI initiative (?10,000 crore outlay) aims to develop domestic capabilities in biologics and biosimilars, reducing import dependence while addressing India’s rising non-communicable disease burden. This aligns with the broader push toward knowledge-intensive industrialisation.
Simultaneously, the ?10,000 crore SME Growth Fund recognises MSMEs as drivers of employment and innovation, moving beyond survival support toward scaling globally competitive firms.
II. Human Capital: From Demographic Dividend to Skilled Workforce
The Budget acknowledges that economic growth without skill formation risks jobless expansion. Hence, it invests in education, skilling, and sector-specific workforce creation.
- AVGC labs in schools and colleges support India’s emerging digital content industry.
- Establishment of girls’ hostels in STEM districts addresses gender gaps in higher education.
- A National Institute of Hospitality and guide training scheme link skilling with tourism-led growth.
Healthcare is treated not only as welfare but also as an employment-intensive care economy. The proposal for Regional Medical Hubs integrates healthcare delivery, research, and medical tourism, positioning India as a global health services destination.
III. Inclusive Growth and Social Sector Interventions
The third pillar of the Budget centres on inclusion. Schemes such as Bharat VISTAAR, an AI-based multilingual agricultural advisory, aim to democratise digital infrastructure for farmers, thereby reducing information asymmetry and climate risk.
Similarly, SHE-Marts build on SHG-based mobilisation to promote women’s entrepreneurship, signalling a shift from credit access to market integration and enterprise ownership.
Mental health infrastructure expansion, regional development in the Northeast, and targeted tourism circuits indicate an attempt to address geographical and social imbalances.
IV. Fiscal Prudence with Growth Orientation
Despite higher expenditure, fiscal consolidation remains on track:
- Fiscal deficit projected at 4.3% of GDP
- Debt-to-GDP ratio on a declining trajectory
This suggests a calibrated approach where growth-enhancing capex is prioritised while maintaining macroeconomic credibility.
V. Tax Reforms: Simplification and Competitiveness
The introduction of the New Income Tax Act (2025) aims to simplify compliance and reduce litigation. Rationalisation of penalties, decriminalisation of minor offences, and automated safe harbour provisions for IT services improve the ease of doing business.
In a bid to attract global capital, tax incentives for data centres, cloud services, and non-resident investors indicate a strategy to integrate India into global value chains in digital and high-tech domains.
VI. Trade Facilitation and Industrial Policy
Customs reforms reduce duties on inputs for critical minerals, clean energy, aviation, and pharmaceuticals, supporting domestic manufacturing. Digitisation of cargo clearance, AI-based risk assessment, and warehouse reforms enhance trade efficiency and logistics competitiveness.
Conclusion
The Union Budget 2026–27 reflects a structural transition in India’s development model—from consumption-led growth to investment, innovation, and inclusion-led expansion. By combining infrastructure investment, industrial policy, human capital formation, and digital governance, the Budget attempts to align short-term growth impulses with the long-term goal of Viksit Bharat. The key challenge lies in effective implementation and coordination with states, which will determine whether these ambitions translate into broad-based socio-economic transformation.
Insurance Laws (Amendment) Bill, 2025

- 04 Dec 2025
In News:
The proposed Insurance Laws (Amendment) Bill, 2025 represents one of the most far-reaching reform efforts in India’s insurance sector in decades. Scheduled for introduction in Parliament, the Bill aims to modernise a regulatory framework rooted in mid-20th century legislation and address the long-standing problem of low insurance penetration, which stood at 3.7% in 2023–24, far below the global average of around 7%. The reform package seeks to enhance capital inflows, deepen market competition, and expand coverage to underserved segments.
100% FDI: Opening the Sector to Global Capital
A cornerstone of the reform is the decision to raise the Foreign Direct Investment (FDI) cap in insurance from 74% to 100%. This shift is expected to attract global insurers, many of whom have not yet entered India’s market. Greater foreign participation could bring in advanced underwriting practices, digital claims management, and sophisticated risk-assessment tools. By reducing reliance on domestic capital and improving operational efficiency, the move aims to expand product innovation and enhance consumer services. The change requires amendments to the Insurance Act, 1938, the LIC Act, 1956, and the IRDAI Act, 1999, signalling a comprehensive legislative overhaul.
Composite Licensing: Breaking Product Silos
Currently, insurers operate in strict silos—life insurers cannot sell non-life products and vice versa. The Bill proposes composite licences, allowing a single entity to offer life, health, and general insurance products under one umbrella. This integration is expected to foster holistic protection solutions, reduce duplication in distribution networks, and align insurance offerings with consumer demand for bundled financial security products.
Lower Capital Norms and New Entrants
To broaden participation, the Bill proposes reducing minimum capital requirements for insurers and reinsurers. This step could enable specialised, regional, and niche players to enter the market, particularly those targeting rural and informal sectors. Such inclusion aligns with India’s long-term goal of achieving “Insurance for All” by 2047. Simultaneously, differentiated capital norms based on business size and risk profile are expected to replace the current uniform approach, encouraging a more diverse ecosystem.
Boost to Reinsurance and Risk Management
The proposal to reduce the net owned funds requirement for foreign reinsurers aims to attract more global reinsurance firms, diversifying a segment currently dominated by a few players. Additionally, allowing large corporations to establish captive insurance entities would strengthen corporate risk management and reduce dependence on external insurers.
Ease of Doing Business in Distribution
The Bill also seeks to reform the intermediary framework through perpetual registration instead of periodic renewals and permitting agents to represent multiple insurers. These steps could expand distribution networks, increase competition, and improve consumer choice.
Conclusion
The Insurance Laws (Amendment) Bill, 2025 marks a decisive move toward global integration, regulatory flexibility, and market deepening. While higher foreign participation and relaxed norms promise capital infusion and innovation, effective oversight will be crucial to ensure consumer protection and financial stability. If implemented well, the reforms could significantly enhance insurance penetration and resilience in India’s evolving risk landscape.
Entrepreneur-in-Residence (EIR) Programme

- 29 Nov 2025
In News:
India’s innovation landscape is witnessing a gradual but significant shift from laboratory-bound research to market-oriented problem solving. The Entrepreneur-in-Residence (EIR) Programme, highlighted recently by the Union Minister of State for Science and Technology, has emerged as a critical instrument in this transition. Introduced under the National Initiative for Developing and Harnessing Innovations (NIDHI), the EIR Programme reflects the government’s effort to embed entrepreneurship within the country’s public research ecosystem and nurture a new generation of scientist-entrepreneurs.
The EIR Programme is designed to encourage graduate students and young researchers to pursue entrepreneurship as a viable career option. It provides both financial and non-financial support in the form of a structured fellowship, enabling innovators to work on high-risk, high-impact ideas within recognised incubation environments. Selected fellows receive a monthly financial support of up to ?30,000 for a maximum period of 12 months, allowing them to focus on ideation, validation and early-stage development without immediate financial pressures. Beyond funding, the programme offers access to Technology Business Incubators (TBIs), mentoring, technical guidance, business advisory services and industry linkages.
Implemented by the Department of Science and Technology (DST) in association with the NCL Venture Centre, Pune, the EIR Programme seeks to bridge the long-standing gap between academic research and commercial application. By embedding entrepreneurial pathways within research institutions, it addresses a structural weakness of India’s innovation system, strong scientific output but limited translation into scalable products and enterprises.
The programme’s growing relevance was underscored at the annual meeting of the Biotechnology Research and Innovation Council (BRIC), where it was described as a cornerstone of India’s biotechnology innovation ecosystem. BRIC, established as a unified umbrella for multiple biotechnology research institutes, represents a shift toward collaborative and translational research. Within this framework, the EIR Programme has helped cultivate researchers who combine academic rigour with market awareness, encouraging them not just to discover, but to deliver solutions with societal and economic impact.
A notable strength of the EIR Programme lies in its ability to attract private sector participation and venture capital interest. By de-risking the early stages of innovation through public funding and institutional support, it creates a pipeline of credible startups emerging directly from public R&D institutions. This has particular significance in sectors such as biotechnology, healthcare, agriculture, green energy and industrial biotechnology, where long gestation periods and high uncertainty often deter private investment at the ideation stage.
The programme also aligns with broader policy objecttives. From a Science and Technology perspective, it promotes translational research, patenting and commercialization, areas increasingly emphasised in national innovation strategies. From an economic standpoint, it supports startup creation, job generation and the development of knowledge-intensive enterprises, complementing initiatives aimed at strengthening MSMEs and deep-tech startups. Ethically and socially, it reinforces values of scientific temper, innovation for public good, collaboration and responsible risk-taking.
However, sustaining the programme’s impact will require scaling up support, expanding interdisciplinary participation, and ensuring stronger regional spread beyond major research hubs. Continuous evaluation of outcomes such as startup survival rates, technology adoption and societal impact will be crucial.
In conclusion, the Entrepreneur-in-Residence Programme represents a strategic shift in India’s approach to innovation, moving from isolated research excellence to integrated, market-linked problem solving. By empowering young researchers to become entrepreneurs within the public research system, it strengthens India’s journey toward a resilient, innovation-driven economy and a globally competitive biotechnology ecosystem.
India’s Fisheries and Aquaculture: Advancing the Blue Transformation
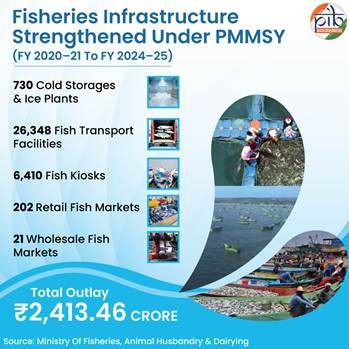
- 23 Nov 2025
In News:
World Fisheries Day 2025 highlighted India’s remarkable rise as a global fisheries and aquaculture powerhouse, while also underscoring the need for urgent policy and sustainability reforms. The Food and Agriculture Organization (FAO) called for a renewed commitment to India’s Blue Transformationa shift from production-centric growth to value addition, ecosystem sustainability, and inclusive livelihoods.
Growth Trajectory and Global Standing
Over the past four decades, India’s aquatic food production has expanded dramaticallyfrom about 2.4 million tonnes in the 1980s to nearly 17.5 million tonnes in 2022–23. This growth has been driven primarily by inland aquaculture, which has become the backbone of India’s fisheries economy. According to FAO’sState of World Fisheries and Aquaculture (SOFIA) 2024, India is now the world’s second-largest aquaculture producer, contributing over 10 million tonnes of aquatic animals annually, second only to China.
Inland fisheries have recorded particularly strong growth, rising by around 140% over the last decade, while total fish production nearly doubled. Marine products exportsled by high-value shrimpcontinue to strengthen India’s external trade footprint, supported by improvements in processing, cold chains, and value addition. The sector sustains nearly 30 million livelihoods, with coastal fishing villages accounting for over two-thirds of national output, underscoring the close link between fisheries growth and coastal ecosystem health.
Policy Push and Institutional Support
India’s fisheries expansion has been backed by sustained policy and institutional reforms. The Pradhan Mantri MatsyaSampada Yojana (PMMSY), with an outlay exceeding ?20,000 crore, has strengthened infrastructure through cold storages, transport facilities, fish kiosks, and landing centres, while also promoting fisher welfare, digital inclusion, and safety at sea. Complementary initiatives such as climate-resilient coastal fishermen villages, vessel tracking systems, and the Marine Fisheries Census 2025 aim to improve resilience, targeting, and governance.
Regulatory and scientific institutionssuch as ICAR fisheries institutes, the Marine Products Export Development Authority, and the National Fisheries Development Boardhave promoted innovation, best practices, and environmental compliance. FAO-supported projects, including climate-resilient aquaculture models in Andhra Pradesh and ecosystem-based fisheries management initiatives in the Bay of Bengal, further reinforce sustainability-oriented reforms.
Emerging Opportunities
India’s blue economy potential is expanding through deeper engagement with global seafood markets, improved traceability systems, and new rules for the sustainable harnessing of the Exclusive Economic Zone. Digital platforms for traceability and certification can help Indian exports meet stringent international standards, improving price realisation and reducing rejection risks. Women-centric interventions under PMMSY and allied schemes also open avenues for inclusive growth through processing, retail, and value-added activities.
Persistent Challenges
Despite rapid progress, structural challenges remain. Overfishing and juvenile catch continue to stress nearshore stocks, while habitat degradationthrough pollution, sedimentation, and seagrass lossundermines nursery grounds. Illegal, unreported and unregulated (IUU) fishing erodes sustainability and equity. Post-harvest losses remain high, and small-scale fishers often face limited access to credit, insurance, and modern technology. Climate change further amplifies risks through extreme weather, warming waters, and disease outbreaks in aquaculture.
Way Forward
The FAO’s call for renewed commitment emphasisesscience-based stock management, expansion of deep-sea fisheries to reduce coastal pressure, robust traceability and certification, and biosecure, climate-resilient aquaculture systems. Investing in resilient harbours, early warning systems, and ecosystem-based approaches will be critical to safeguard livelihoods and biodiversity.
Conclusion
India’s fisheries and aquaculture sector stands at a pivotal moment. Having achieved scale and global prominence, the next phase of India’s Blue Transformation must prioritise sustainability, value addition, and inclusivity. With coordinated policy action, scientific management, and strong institutional support, India can convert its fisheries momentum into a resilient, competitive, and environmentally responsible blue economy that secures livelihoods, nutrition, and long-term ecological balance.
ATC Automation Failure at Delhi IGI Airport
- 20 Nov 2025
In News:
In November 2025, air traffic operations at Indira Gandhi International Airport, India’s busiest aviation hub, were severely disrupted due to a prolonged technical failure in the Automatic Message Switching System (AMSS). The outage, which lasted for more than 24 hours, delayed over 800 flights and had cascading effects across the national aviation network. While flight safety was not compromised, the incident exposed critical vulnerabilities in India’s air traffic control (ATC) automation infrastructure and underscored the urgency of systemic modernisation.
Role of AMSS in Air Traffic Management
AMSS functions as the core communication backbone of ATC operations in major Indian metros such as Delhi, Mumbai, Chennai and Kolkata. It automatically receives, stores and routes vital aeronautical messages via the Aeronautical Fixed Telecommunications Network (AFTN) and its modern successor, the Aeronautical Message Handling System (AMHS). These messages include flight plans, departure and arrival updates, NOTAMs, meteorological data and coordination messages between airlines and controllers. Crucially, AMSS feeds data into the Flight Data Processing System (FDPS), which enables ATC automation.
When AMSS failed at Delhi, controllers could see aircraft on radar but lacked access to flight plan data such as routes, altitudes and timings. As a result, more than 2,500 daily aircraft movementsincluding scheduled flights and overflightshad to be managed manually, significantly slowing operations and increasing workload.
Causes and Vulnerabilities
Preliminary assessments point to synchronisation failure between primary and standby servers, delayed system switchover and corrupted message queues. These issues were aggravated by structural weaknesses in the system: legacy server architecture supplied by a foreign vendor, outdated message-switching software, limited redundancy and poor integration with automation and network routers. A shortage of specialised local technical expertise further delayed resolution.
The incident corroborated warnings raised earlier by the Air Traffic Controllers’ Guild and echoed in the Parliamentary Standing Committee’s 380th Report (August 2025), which flagged performance degradation, system lag and outdated functionalities in ATC automation at major airports.
Broader Implications
India’s air traffic systems lag behind global benchmarks such as Federal Aviation Administration and Eurocontrol, which deploy AI-enabled conflict detection, predictive traffic flow analytics and seamless real-time data sharing. In India, the absence of such tools forces Air Traffic Controllers to compensate manually, increasing cognitive load and the risk of human error. With air traffic volumes growing rapidly, these technological gaps constrain airspace capacity and operational efficiency.
Compounding concerns were reports of possible GPS spoofing incidents around the same time, prompting an inquiry by national security authorities. Though no direct causal link was established, the coincidence highlighted the need for resilient systems capable of handling concurrent technological disruptions.
Government Response and Way Forward
The Ministry of Civil Aviation directed the Airports Authority of India to conduct a root-cause analysis, install additional backup servers and accelerate migration from AMSS to a modern, nationwide AMHS-based system with automatic failover. Plans also include deploying ADS-B ground stations, enhancing automation tools and shifting towards satellite-based navigation.
Conclusion
The Delhi IGI ATC glitch was not merely a technical failure but a systemic warning. It revealed the risks of operating critical national infrastructure on aging technology amid surging traffic volumes. For India to sustain safe, efficient and globally competitive aviation growth, urgent, comprehensive modernisation of air traffic managementcombining redundancy, advanced analytics and skilled manpoweris indispensable.
Strengthening Regulatory Governance
- 15 Nov 2025
In News:
The Securities and Exchange Board of India (SEBI) has initiated a major reform process aimed at enhancing transparency, accountability, and ethical conduct within the organisation. In response to concerns over conflicts of interest and allegations involving former SEBI Chairperson Madhabi Puri Buch and offshore financial links—claims denied by the individuals involved—the regulator constituted a High-Level Committee (HLC) in March 2025. This six-member panel, led by former Chief Vigilance Commissioner Pratyush Sinha, has proposed a comprehensive set of ten recommendations intended to overhaul SEBI’s internal governance standards and align them with global best practices followed by regulatory bodies such as the U.S. Securities and Exchange Commission (SEC) and the European Securities and Markets Authority (ESMA).
A key recommendation of the HLC is the establishment of a multi-tier disclosure framework. The Chairperson, Whole-Time Members (WTMs), and senior officials at the level of Chief General Manager (CGM) and above would be required to publicly disclose their assets and liabilities, covering movable and immovable property, investments, and outstanding liabilities. All other employees would file internal disclosures detailing their financial interests, professional relationships, and connections with relatives as defined under the Companies Act, 2013. This framework aims to strengthen public confidence in the regulator’s independence and integrity.
Another critical reform area involves mandatory conflict-of-interest declarations at the time of appointment. Applicants for top SEBI positions must disclose actual, potential, or perceived conflicts of both financial and non-financial nature. Such early disclosures allow the appointing authority to assess ethical suitability and mitigate risks before onboarding senior personnel.
The committee also recommended stringent investment and trading restrictions for SEBI leadership and employees. New investments should be limited to professionally managed pooled funds regulated by Indian financial regulators. For existing investments held at the time of appointment or joining, senior officials must choose among four options: liquidation, freezing, sale through a pre-approved trading plan, or sale with prior SEBI approval. Further, the HLC has advised that the Chairperson and WTMs be classified as “insiders” under the SEBI (Prohibition of Insider Trading) Regulations, 2015, placing them under enhanced scrutiny and disclosure obligations.
To ensure consistency, the committee proposed a broader definition of ‘family’. The revised definition would include spouses, dependent children, individuals for whom officials are legal guardians, and persons related by blood or marriage who are substantially dependent on the employee. This harmonisation between the SEBI Code of Conduct (2008) and the SEBI Employees’ Service Regulations (2001) seeks to remove ambiguities in assessing indirect conflicts of interest.
The HLC also recommended a blanket ban on acceptance of gifts from entities that have or may have official dealings with SEBI. A structured recusal mechanism must be institutionalised, requiring officials to step aside from decision-making roles in matters where conflicts exist. An annual summary of recusals by top officials should be included in SEBI’s Annual Report to enhance transparency.
Finally, the committee proposed post-retirement restrictions, preventing former members and employees from representing parties before SEBI for two years after exit. It also advocated a secure, confidential, anonymous whistle-blower system open not just to employees but also to market intermediaries and the public, ensuring a broad-based mechanism to detect ethical breaches.
Once approved by the SEBI Board and the Ministry of Finance, these recommendations will be incorporated into SEBI’s revised Code of Conduct with prospective applicability. Collectively, these reforms aim to fortify regulatory governance, restore public trust, and uphold the autonomy and integrity of India’s capital markets ecosystem.
National Household Income Survey and Key Household Finance Surveys

- 10 Nov 2025
In News:
Reliable, granular, and credible data form the backbone of effective economic policymaking. Recognising long-standing gaps in household-level economic statistics, the Ministry of Statistics and Programme Implementation (MoSPI) is preparing to undertake a set of ambitious and methodologically challenging surveys over the coming years. At the centre of this effort is India’s first-ever pan-India National Household Income Survey (NHIS), alongside two major surveys on household finances—the All-India Debt and Investment Survey (AIDIS) and the Situation Assessment Survey (SAS) of Agricultural Households. Together, these exercises aim to significantly strengthen India’s evidence base on income distribution, indebtedness, assets, and rural livelihoods.
National Household Income Survey (NHIS): A Long-Awaited Exercise
The NHIS, slated to begin in February 2026 with results expected by mid-2027, seeks to fill a critical void in India’s statistical system: the absence of a dedicated, nationwide dataset on household income distribution. According to MoSPI Secretary Saurabh Garg, income surveys are globally among the most difficult statistical exercises, and India’s own experience bears this out.
Historical Context and Challenges
India has attempted to measure household incomes multiple times:
- In the 1950s, income questions were embedded experimentally within consumer expenditure surveys.
- The 1960s Integrated Household Survey and feasibility exercises in the 1980s also explored income estimation.
These efforts were discontinued because reported incomes were often lower than the combined estimates of consumption and savings, raising serious concerns about data reliability. Household hesitancy to disclose income from multiple sources, especially informal earnings, has been a persistent obstacle.
Pre-Survey Findings: Trust Deficit
A pre-testing exercise conducted by MoSPI in August 2025 revealed the core challenge facing NHIS:
- 73% of respondents found the questionnaire relevant,
- 84% understood the purpose partially or well,
- Yet 95% considered income-related information “sensitive”,
- 95% felt uncomfortable disclosing income from different sources,
- A majority refused to answer questions on income tax paid.
These findings underline that the success of NHIS will depend less on technical design and more on public trust, awareness, and assurances of anonymity.
Institutional Safeguards
To address concerns of credibility and methodology, MoSPI has constituted a Technical Expert Group (TEG) chaired by Surjit S. Bhalla, former Executive Director for India at the IMF. The TEG will:
- Oversee survey design and implementation,
- Guide validation and finalisation of results,
- Advise on the nature of release—whether as a full national survey, pilot, or experimental dataset.
Given past controversies, such as the non-release of the 2017–18 Consumer Expenditure Survey due to data quality issues, MoSPI has emphasised that the NHIS results will be released only after rigorous expert scrutiny to ensure credibility.
Complementary Surveys: AIDIS and SAS (2026–27)
Alongside NHIS, MoSPI has announced that two nationally representative surveys will be conducted between July 2026 and June 2027, further enriching India’s household-level economic data.
All-India Debt and Investment Survey (AIDIS)
AIDIS is one of India’s most significant surveys on household finance, covering both rural and urban areas. It provides critical data on:
- Household indebtedness,
- Asset ownership and wealth distribution,
- Structure and reach of credit markets.
Its findings are widely used for:
- National accounts preparation,
- Assessing inequality in asset distribution,
- Informing policy decisions of the Reserve Bank of India, MoSPI, and other institutions.
Situation Assessment Survey (SAS) of Agricultural Households
First launched in 2003, the SAS focuses on the economic conditions of farming households. It covers:
- Income and expenditure patterns,
- Indebtedness and access to credit,
- Land and livestock ownership,
- Crop and livestock production, farming practices, and technology use,
- Access to government schemes and crop insurance.
The survey informs policymaking by the Ministry of Agriculture and Farmers Welfare, NITI Aayog, financial institutions, and researchers, particularly in the context of rural distress, farm incomes, and agricultural reforms.
MoSPI has also adopted a consultative approach by placing draft concept notes and schedules of AIDIS and SAS in the public domain, inviting feedback from policymakers, researchers, farmer groups, and financial institutions.
Household Debt Dynamics in India
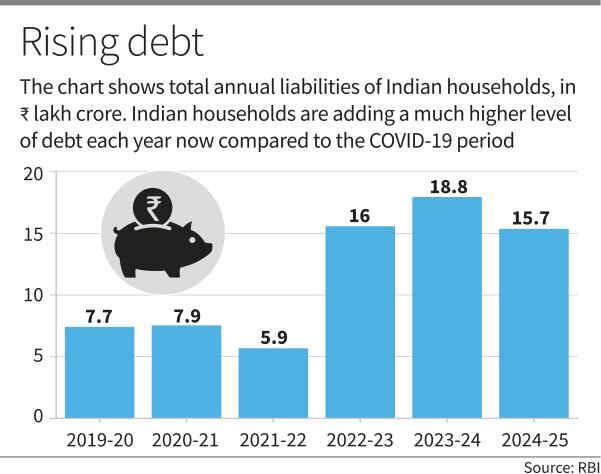
- 04 Nov 2025
In News:
Recent financial accounts released by the Reserve Bank of India for 2024–25 highlight an important shift in household balance sheets: liabilities are expanding at a faster rate than financial assets. This trend has implications for savings behaviour, macroeconomic stability, and the broader investment cycle.
Household Asset and Liability Patterns: Key Findings
1. Asset Accumulation Slowing
Indian households continue to be net savers, yet the pace of asset formation has moderated.
- Annual financial assets increased from ?24.1 lakh crore in 2019–20 to ?35.6 lakh crore in 2024–25, marking a 48% rise.
- As a share of GDP, however, asset formation declined from 12% to 10.8%, reflecting slower savings growth relative to economic expansion.
2. Faster Build-Up of Liabilities
Household borrowing has expanded sharply during the same period.
- Liabilities more than doubled, rising from ?7.5 lakh crore to ?15.7 lakh crore—a 102% increase.
- Their share in GDP rose from 3.9% to 4.7%.
- Household debt peaked at 6.2% of GDP in 2023–24, with a mild moderation in 2024–25, indicating early signs of financial stabilization.
3. Changing Savings Preferences
While bank deposits remain the principal savings instrument, households are increasingly moving toward:
- Mutual funds
- Market-linked products
- Non-traditional financial investments
This diversification points to a maturing financial ecosystem and improving financial literacy, but also increases exposure to market volatility.
Drivers of the Rising Debt Trend
- Post-pandemic consumption recovery, supported by increased reliance on credit.
- Housing and personal loans expanding faster than incomes, especially in urban India.
- Low or moderate interest rate cycles encouraging borrowing.
- Shift toward financialisation of households, with more participation in equity and debt markets.
Implications for the Economy
1. Pressure on the Household Savings Rate
A slower pace of savings growth may:
- Reduce the pool of domestic capital available for investment,
- Affect long-term capital formation,
- Increase dependence on external financing for growth.
2. Vulnerability to Economic Shocks
The rise in consumer leverage heightens exposure to:
- Interest-rate tightening,
- Income disruption due to economic downturns,
- Asset price corrections in financial markets.
3. Mixed Outcomes from Market-Linked Assets
While deeper financial participation is positive, households increasingly carry:
- Higher market risk,
- Greater sensitivity to financial cycles.
Conclusion
The latest RBI data reveal a structural shift in household balance sheets, with liabilities growing more rapidly than assets. Though this reflects rising aspirations and financial deepening, it also signals potential stress points if income growth fails to keep pace or if macroeconomic conditions tighten. Ensuring sustained income growth, robust consumer protection, and balanced credit expansion will be essential to preserve household financial resilience and support long-term economic stability.
Powering India’s Green Transition and Strategic Self-Reliance: The Role of Critical Minerals

- 03 Nov 2025
In News:
India’s commitment to achieving a low-carbon, technologically advanced economy has sharpened the focus on securing access to rare earths and critical minerals, which underpin clean energy systems, electronics, aerospace, and defence platforms. The launch of the National Critical Mineral Mission (2025) marks a decisive step toward building resilience in mineral supply chains and reducing external dependencies, thereby aligning India’s development trajectory with its climate and strategic objectives.
Significance of Rare Earths and Critical Minerals
Critical minerals are indispensable to the global green transition. They power electric vehicles (EVs), lithium-ion batteries, solar photovoltaics, wind turbines, and semiconductor devices. Their role extends into national security domains, informing the design of precision-guided weapons, jet engines, satellite systems, and next-generation communication networks. Rare earth elements (REEs)—a subset of critical minerals—enable high-strength magnets essential for renewable energy, robotics, and missile guidance. As countries race toward net-zero commitments, the demand for these minerals is projected to increase severalfold, amplifying concerns over supply vulnerabilities.
India’s Context: Climate Goals and Strategic Imperatives
India seeks to reduce the emissions intensity of its GDP by 45% by 2030 and achieve net-zero emissions by 2070. Meeting these targets requires rapid expansion of renewable energy and storage capabilities, both of which depend heavily on minerals such as lithium, cobalt, nickel, graphite, silicon, neodymium, and dysprosium. Despite possessing the fifth-largest rare earth reserves globally, India lacks adequate refining, metallisation, and magnet-manufacturing infrastructure, leading to significant reliance on imports. More than 60% of global processing capacity lies in China, exposing India to supply disruptions and geopolitical risks.
Applications Across Sectors
- Renewable Energy: Silicon, gallium, and indium drive photovoltaic technologies; rare-earth magnets enhance wind turbine efficiency.
- Electromobility & Storage: Lithium, cobalt, and nickel form the backbone of battery chemistry for EVs and grid-scale storage.
- Electronics & Semiconductors: Copper, tungsten, and tin support microprocessors, circuit boards, and high-end computing.
- Defence & Aerospace: Titanium alloys and REE magnets strengthen jet engines, missiles, and satellites.
- Medical Technologies: Critical minerals are used in MRI machines, pacemakers, and imaging equipment.
Challenges in Building a Secure Mineral Ecosystem
India faces multiple hurdles:
- High import dependence for crucial minerals and processing technologies.
- Technological gaps in advanced separation, refining, and recycling processes.
- Environmental concerns over mining-related pollution, requiring stringent safeguards.
- Regulatory delays due to fragmented jurisdiction and slow clearances.
- Skill and financing deficits for large-scale exploration and processing.
Government Initiatives
The National Critical Mineral Mission (2025) aims to create an end-to-end domestic value chain—from exploration to recycling. Reforms under the MMDR Act (2023) introduced 24 critical minerals for centralised auction, improving transparency. The KABIL joint venture has secured lithium assets in Argentina and strengthened partnerships with Australia. Customs duty exemptions on critical minerals (2025), establishment of processing parks, and the promotion of circular-economy-based recycling reflect a multi-pronged strategy.
Way Forward
India must prioritise building a domestic value chain encompassing exploration, processing, magnet manufacturing, and battery component production. Enhanced funding for R&D and startup innovation in refining and recycling technologies is essential. Diversifying imports through strategic partnerships, enforcing sustainable mining norms, and integrating mineral strategy with Make in India, the Green Hydrogen Mission, and energy transition policies will be critical.
Conclusion
Critical minerals form the backbone of India’s green transition and strategic autonomy. The National Critical Mineral Mission represents a shift toward resilience and long-term sustainability. By investing in exploration, innovation, and circularity, India can emerge as a global hub in the clean-tech and critical mineral value chain, strengthening both its climate commitments and national security.
The Employability Crisis in India: Rethinking Academia–Industry Collaboration

- 01 Nov 2025
In News:
India is grappling with a growing employability crisis, underscored by the fact that only 42.6% of graduates are considered job-ready. This mismatch between academic training and labour market needs has become a structural challenge, affecting productivity, economic growth, and youth aspirations. The crisis signals a systemic misalignment rather than a shortage of talent.
Understanding Employability
Employability today goes beyond academic qualifications. It includes the ability to:
- Acquire and apply knowledge in real-world contexts.
- Adapt to evolving technologies and workplace demands.
- Engage in lifelong learning, unlearning, and relearning.
- Demonstrate soft skills, value creation, and ethical behaviour.
Modern industries require graduates who combine technical capability with communication, teamwork, problem-solving, and a growth mindset.
Causes of the Academia–Industry Divide
Academic Factors
- Outdated Curriculum: Syllabi often fail to match rapid technological changes, new job roles, and automation trends.
- Theory-Oriented Pedagogy: Learning remains exam-centric with limited exposure to practical projects, internships, or problem-solving environments.
- Soft Skills Deficit: Institutions provide little training in communication, adaptability, workplace behaviour, and emotional intelligence.
Industry Factors
- High Expectations: Employers expect “ready-to-deploy” graduates but invest minimally in onboarding or mentoring.
- Rapid Technological Shifts: Industry skill needs evolve faster than academia can adjust, widening the skills gap.
- Weak Collaboration: Companies often view academic institutions as outdated, resulting in minimal engagement in curriculum design or research.
- Short-Term Approach: Recruitment is prioritised over building robust, long-term skill ecosystems.
Government and Institutional Initiatives
- National Education Policy (NEP) 2020: Encourages experiential learning, flexibility, internships, and stronger industry linkages.
- AICTE Internship Mandate: Requires engineering students to undergo industrial exposure.
- Skill India Mission: Strengthens vocational education through Sector Skill Councils aligned with market needs.
- NASSCOM FutureSkills PRIME: Upskills youth in digital technologies such as AI, data analytics, and cybersecurity.
These initiatives aim to modernise learning pathways and improve alignment with industry demands.
Challenges in Implementation
Despite reforms, several structural challenges persist:
- Curricular Inertia: Bureaucratic hurdles delay rapid updates in university syllabi.
- Fragmented Skills Ecosystem: Weak coordination among government, academia, and industry limits policy effectiveness.
- Faculty Skill Gaps: Many educators lack exposure to new technologies and contemporary workplace practices.
- Urban–Rural Divide: Smaller and rural institutions suffer from poor infrastructure and limited corporate linkages.
- Low Industry Investment: Companies underinvest in academia–industry partnerships and long-term talent development.
Way Forward
- Structural Reforms
- Curriculum Co-Design: Regular, collaborative revision of syllabi with inputs from employers, universities, and policymakers.
- Dual-Learning Model: Embed apprenticeships, live projects, and work-integrated learning into higher education.
- Faculty Immersion: Promote faculty internships, industry sabbaticals, and continuous upskilling.
- Skills and Ethics
- Soft Skills & Ethics Labs: Establish dedicated centres for communication, workplace ethics, and emotional intelligence.
- Outcome-Based Tracking: Use data to monitor alumni career trajectories and skill relevance.
- Industry Engagement: Incentivise long-term corporate participation in curriculum development, research, and training.
Conclusion
India’s employability challenge is fundamentally an issue of alignment, not ability. Bridging the gap between academia and industry requires shared responsibility, continuous innovation, and sustained collaboration. When education becomes practical, dynamic, ethical, and closely connected to the world of work, India can unlock its demographic potential and build a resilient, future-ready workforce.
Poverty Measurement in India: Revisiting the Rangarajan Line and the Rise of Multidimensional Poverty
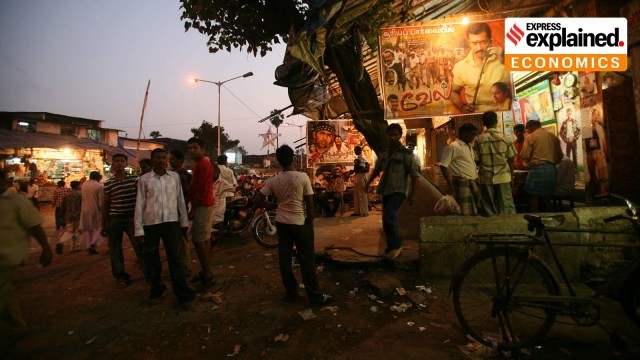
- 21 Oct 2025
In News:
The debate on poverty measurement in India has gained renewed significance with the Reserve Bank of India’s Department of Economic and Policy Research (DEPR) updating state-wise poverty estimates using the 2022–23 Household Consumption Expenditure Survey (HCES). This marks the first major recalibration of the C. Rangarajan Committee’s poverty line, originally formulated in 2014, and reflects shifting paradigms in assessing deprivation in India.
Revisiting the Rangarajan Framework
The Rangarajan Committee was tasked with redefining poverty beyond the earlier Tendulkar methodology. It fixed the poverty line at ?972 per capita per month in rural India and ?1,407 in urban areas (2011–12 prices), categorising about 29.5% of the population as poor. Its poverty basket focused on minimum nutritional requirements along with basic spending on health, education, fuel, clothing, and rent. Unlike later approaches, it offered a strict consumption-based benchmark rooted in monetary expenditure.
Updated Poverty Trends: State-wise Insights
RBI economists reconstructed poverty lines for 20 major states based on HCES 2022–23 data using a new price index aligned with the original poverty line basket rather than Consumer Price Index weights. The findings highlight remarkable improvements, with major reductions observed in traditionally backward states:
- Odisha: Rural poverty fell from 47.8% (2011–12) to 8.6% (2022–23)
- Bihar: Urban poverty dropped from 50.8% to 9.1%
- Kerala: Rural poverty declined to 1.4%; Himachal Pradesh’s urban poverty fell to 2%
- Lowest poverty levels: Rural Himachal Pradesh (0.4%) and urban Tamil Nadu (1.9%)
- Highest poverty levels: Chhattisgarh (25.1% rural; 13.3% urban)
These transformations reflect improved rural infrastructure, livelihood programmes, PDS reforms, and social transfers. Yet persistent poverty in central Indian states underscores uneven development and structural gaps in employment quality, agrarian distress, and welfare delivery.
Methodological Continuity and Debate
Poverty estimates vary sharply across institutions, illustrating the sensitivity of measurement frameworks:
- SBI (2023–24): ~4–5% poverty
- World Bank (2022): 10.2% poverty in 2019
- IMF (2022): 0.8% in 2019 (including food transfers)
These disparities stem from differing inflation adjustments, survey datasets, and treatment of welfare subsidies. They also fuel a longstanding debate: can income-based poverty capture human deprivation comprehensively, especially in a transforming economy with evolving consumption patterns?
Shift to Multidimensional Poverty
Official focus has now decisively shifted to multidimensional poverty aligned with SDG frameworks. India’s Multidimensional Poverty Index (MPI) evaluates deprivation across twelve indicators spanning health, education, and living standards. According to NITI Aayog (2024), 24.82 crore people exited multidimensional poverty between 2013–14 and 2022–23, reducing MPI from 29.17% to 11.28%. This highlights the impact of welfare architecture—PDS expansion, Ujjwala, Saubhagya, Jal Jeevan Mission, Swachh Bharat, and financial inclusion.
Way Forward
- Regular poverty line updates reflecting new consumption patterns and regional price realities
- Integration of income and multidimensional metrics for balanced welfare planning
- Timely survey releases and transparent data to strengthen evidence-based policymaking
- Targeted interventions for lagging states like Chhattisgarh, Jharkhand, and parts of UP
- Leveraging digital delivery systems to minimise leakages and enhance inclusivity
Conclusion
India’s poverty trajectory reflects a dual narrative—sharp improvements driven by welfare provisioning and growth, yet uneven progress across regions and methodological contestation. While the Rangarajan line continues to serve as a benchmark for monetary poverty, the dominance of multidimensional metrics signals a shift towards understanding deprivation as a matter of human capability, not merely income. Ensuring sustained and equitable poverty reduction will require methodological rigor, policy innovation, and heightened focus on lagging geographies to achieve inclusive development.
Google’s $15 Billion AI Data Centre in Andhra Pradesh
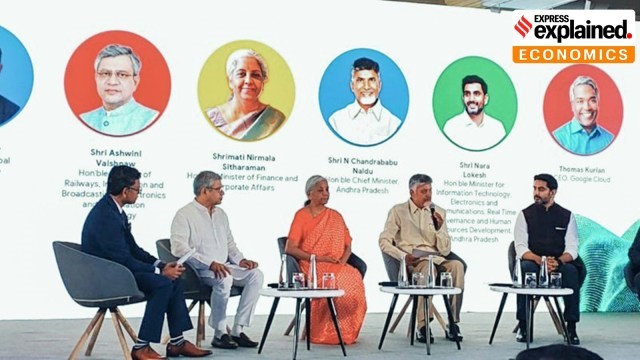
- 18 Oct 2025
In News:
Google’s announcement of a USD 15-billion investment to establish an Artificial Intelligence (AI) data centre in Visakhapatnam marks a transformational moment in India’s digital infrastructure landscape. The initiative, the largest single investment by Google in India, comes amid a geo-economic context of recalibrating India-US relations and the government’s emphasis on technological self-reliance and swadeshi digital systems. The project positions India as an emerging hub in global AI capability and computing power.
Why AI Data Centres Matter
AI-focused data centres differ fundamentally from conventional facilities. While traditional data centres are built around CPU-based servers to support cloud storage, websites, and enterprise applications, AI data centres rely on high-performance GPUs to handle data-heavy and compute-intensive workloads such as generative AI, advanced analytics, image/video processing, and deep-learning models. This makes them significantly more power-intensive and infrastructure-demanding, requiring robust energy supply and advanced cooling systems.
According to estimates cited by Google, the Visakhapatnam AI hub is expected to add at least USD 15 billion to the US GDP between 2026 and 2030 through increased AI adoption and cloud-driven activity, demonstrating the cross-border economic impact of such investments.
Partnerships and Green Infrastructure
The facility is being developed in partnership with AdaniConneX and Airtel, leveraging the same backbone used for Google’s global platforms like Search, YouTube, and Workspace. The project includes building a major subsea cable landing station, linking eastern India to Google’s expansive global cable network, enhancing international data routes and reducing latency.
A key dimension of the partnership lies in sustainable power and energy independence. AdaniConneX, a joint venture between Adani Enterprises and EdgeConneX, will provide 100% clean energy, supported by new transmission lines, renewable generation, and energy storage facilities in Andhra Pradesh. This aligns with India’s climate commitments and enhances grid resilience.
Economic Impact and Capacity Expansion
India’s data centre industry, currently valued at ~USD 10 billion with USD 1.2 billion in FY24 revenue, is projected to add 795 MW of capacity by 2027 — reaching 1.8 GW. Google’s project alone is expected to generate nearly 1.88 lakh direct and indirect jobs, strengthening regional development and high-skilled employment.
However, high capital costs and limited job intensity remain policy concerns. Approximately 40% of capex in data centres goes towards electrical systems, and 65% of operating costs are attributed to electricity, with ~?60–70 crore required per MW of capacity. This necessitates a careful assessment of incentives and long-term strategic benefits.
Energy Security and the Nuclear Option
The International Energy Agency (IEA) predicts that global data-centre electricity demand may double by 2026, raising questions around sustainability. While renewable energy remains the mainstay, its intermittency has prompted policy consideration of nuclear energy as a round-the-clock clean power source — a trend already visible in the United States and now emerging in India’s energy strategy.
Conclusion
Google’s AI hub in Visakhapatnam represents a strategic convergence of digital infrastructure, clean-energy innovation, and global technological cooperation. For India, it underscores the dual challenge of expanding digital capability while ensuring energy security and environmental sustainability. The success of this initiative will influence India’s journey toward becoming a global digital superpower underpinned by resilient, sovereign, and sustainable compute ecosystems.
2025 Nobel Prize in Economic Sciences: Understanding Innovation-Driven Growth

- 16 Oct 2025
In News:
The 2025 Nobel Prize in Economic Sciences has been awarded to Joel Mokyr, Philippe Aghion, and Peter Howitt for their seminal contributions to explaining how innovation drives long-term economic growth. Their work collectively answers a fundamental question in development economics: why has sustained growth become the norm in the last two centuries, despite millennia of stagnation? While Mokyr approaches the issue through economic history, Aghion and Howitt construct a formal model illustrating the dynamics of innovation and competition in modern economies.
Mokyr’s Framework: Useful Knowledge and Openness to Change
Joel Mokyr argues that economic stagnation persisted through most of human history because innovation lacked a strong scientific foundation. Prior to the Industrial Revolution, technological progress was primarily prescriptive—people knew how to produce goods but not why processes worked as they did. This limited systematic improvement.
The transformation began during the Scientific Revolution (16th–17th centuries) when controlled experimentation, measurement, and reproducibility became central to knowledge creation. This generated “useful knowledge”—a synergy of propositional (scientific principles) and prescriptive (practical techniques) knowledge. Examples include improvements in the steam engine driven by insights into atmospheric pressure and advancements in steel production based on understanding carbon reduction in iron.
However, knowledge alone was not sufficient. Societal openness to change, a hallmark of Enlightenment thought, enabled technological disruption. Acceptance of new ideas, weakening of entrenched elites, and institutional reforms—from the British Parliament curbing aristocratic privileges to society’s rejection of Luddite resistance to machinery—allowed innovations to diffuse widely. According to Mokyr, skills-based human capital and a culture supportive of disruption are crucial pillars of sustained growth.
Aghion–Howitt’s Creative Destruction Model
Drawing on Joseph Schumpeter’s concept of creative destruction, Aghion and Howitt develop a rigorous macroeconomic model explaining how innovation displaces old technologies and firms, generating productivity gains. Their model shows that firms invest in research and development (R&D) to secure temporary monopoly power through patents. This monopoly incentivizes innovation, yet it is continually threatened by newer technologies. Thus, growth emerges from a constant cycle of competition, firm turnover, and technological leaps.
Importantly, their general equilibrium framework links household savings, financial markets, production decisions, and innovation incentives, demonstrating that micro-level disruptions are essential for macro-level stability. Empirical trends—such as high annual firm entry and exit rates in developed economies—support their argument.
Policy Implications
The Nobel findings highlight key contemporary debates:
- R&D Subsidies: Innovation has positive spillovers beyond private profit. Public funding can correct under-investment, but excessive subsidies risk waste where gains are marginal.
- Social Safety Nets: Creative destruction benefits economies but harms displaced workers and firms. A balanced welfare ecosystem ensures societies remain open to technological change.
- Skilling and Human Capital: To convert ideas into output, governments must invest in education, vocational training, and research ecosystems.
Conclusion
The 2025 Nobel laureates collectively establish that economic growth is neither automatic nor guaranteed—it is the result of science-based knowledge creation, institutional openness, and dynamic competition. For emerging economies like India, fostering innovation-driven growth requires strong research systems, regulatory flexibility, investment in human capital, and social policies that cushion transition shocks. Their work underscores that sustainable progress lies in embracing change, not resisting it.
India’s Grain-Driven Ethanol Transition: Shifting Paradigms in Biofuel Policy
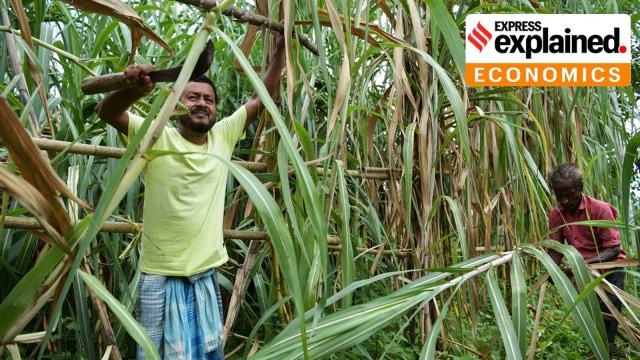
- 15 Oct 2025
In News:
India’s ethanol blending programme, originally launched to reduce oil imports and stabilise the sugar industry, is undergoing a transformative shift. What began as a sugarcane-centric initiative has evolved into a grain-based ethanol ecosystem, reflecting structural changes in agricultural markets, energy policy, and rural industrialisation. For the first time, grain-derived ethanol—predominantly from maize—has surpassed sugarcane-based production, marking a pivotal moment in India’s biofuel sector.
Evolution of Ethanol Blending
The Ethanol Blending Programme (EBP) was initially designed to create additional revenue streams for sugar mills and ensure timely payments to cane growers. Early production relied on C-heavy molasses, a by-product of sugar extraction. Policy reforms in 2018 incentivised diversion of B-heavy molasses and even direct cane juice toward ethanol, raising supplies from 38 crore litres in 2013-14 to nearly 189 crore litres by 2018-19, and increasing blending levels from 1.6% to nearly 5%. This stabilised the sugar economy and boosted rural incomes.
Rise of Grain-Based Ethanol
A crucial turning point came when the government permitted ethanol production from grains such as maize, rice, and damaged foodgrains, offering differential pricing to attract investment. Grain-based distilleries rapidly expanded across Punjab, Haryana, Bihar, Madhya Pradesh, Maharashtra, Karnataka, and other states, with over ?40,000 crore invested in facilities capable of using multiple feedstocks.
By 2023-24, of the 672.49 crore litres supplied to Oil Marketing Companies (OMCs), almost 60% came from grains, with maize accounting for the largest share. In 2024-25, grain-based ethanol procurement is expected to reach 620 crore litres, with maize alone contributing about 420 crore litres. Drought-induced sugarcane shortages and more attractive prices—?71.86 per litre for maize-based ethanol versus ?57.97–65.61 per litre for cane-based routes—accelerated the shift.
Capacity and Policy Dynamics
India today hosts 499 distilleries with an annual ethanol capacity of 1,822 crore litres. Against a 20% blending target, OMCs sought 1,050 crore litres for 2025-26, but received offers exceeding 1,776 crore litres—signalling emerging overcapacity. While this capacity enhances energy security and reduces crude imports (over $160 billion annually), it introduces new challenges in balancing supply, food security, and price stability.
Challenges: Food Security, Sustainability, and Market Balance
India now faces a classic food-versus-fuel dilemma. Producing ~420 crore litres of maize ethanol consumes over 11 million tonnes of maize, nearly 26% of national output. With maize being vital for poultry and livestock feed, diversion to fuel can raise feed costs and food inflation. Similarly, viability of rice-based ethanol hinges on surplus FCI stocks—an uncertain variable.
Environmental concerns are also emerging. While ethanol reduces carbon emissions, grain-based production increases pressure on water, land, and fertiliser use, particularly in maize-growing regions.
Way Forward
Policy refinements are underway to ensure a balanced biofuel strategy. A dual-feedstock approach—leveraging both cane and grains—along with scaling second-generation (2G) biofuels from agricultural waste, is expected to drive future growth. Adequate stock monitoring, sustainable cultivation practices, and technological innovation will be critical for achieving the 20% blending target by 2025-26 without compromising food security.
Conclusion
India’s ethanol revolution demonstrates strategic economic diversification, rural industrialisation, and commitment to energy transition. However, sustaining this momentum requires calibrated policies aligning energy security with agricultural sustainability, food availability, and environmental stewardship—critical considerations for a resilient and self-reliant biofuel future.
Credit Reforms to Deepen Financial Markets
- 13 Oct 2025
In News:
India’s journey toward Viksit Bharat 2047 hinges on simultaneously nurturing human capital and modernising financial institutions. Two recent developments reflect this integrated approach: the Viksit Bharat Buildathon 2025 and the Reserve Bank of India’s initiatives to strengthen financial markets and internationalise the rupee. Together, they illustrate India's twin strategy of empowering youth as innovation leaders while deepening economic capacity and regional influence.
Fostering a Culture of Innovation: Viksit Bharat Buildathon 2025
- The Viksit Bharat Buildathon, launched by the Ministry of Education in collaboration with NITI Aayog’s Atal Innovation Mission, is India’s largest school-level hackathon, engaging 1 crore students across classes 6–12.
- Aligned with NEP 2020, it aims to build problem-solving aptitude and innovation competencies from grassroots levels. Students work in teams to design prototypes based on four themes central to India’s development discourse—Atmanirbhar Bharat, Swadeshi, Vocal for Local, and Samriddh Bharat.
- The event adopts a phased structure: registrations (September), nationwide live build on 13 October 2025, and final evaluation by December. With Rs 1 crore award pool and dedicated mentorship from innovation networks and higher education institutions, it incentivises early exposure to experiential learning, creativity, and entrepreneurship. Importantly, it prioritises participation from Aspirational Districts, tribal belts, and frontier regions, promoting inclusivity in innovation ecosystems.
- By integrating rural and underserved communities, the initiative aligns with the principle of technology-enabled social justice and fosters an innovation-ready workforce. It positions schoolchildren not merely as future beneficiaries but as current contributors to nation-building—a step crucial for demographic dividend utilisation.
Rewiring India’s Financial System: RBI’s Strategic Reforms
Parallelly, the Reserve Bank of India has initiated significant policy reforms to bolster India’s financial depth and global standing. It has permitted banks to finance corporate mergers and acquisitions—a domain previously dominated by NBFCs—allowing formal banking channels to support corporate consolidation, expansion, and competitiveness. This move reflects confidence in banking sector resilience and recognises that scale and efficiency are essential for domestic firms in a globalising economy.
In a landmark regional diplomacy initiative, RBI has authorised Indian banks and their overseas branches to provide rupee-denominated loans to residents of neighbouring countries. This step supports rupee internationalisation, reduces dependence on the US dollar for regional transactions, and enhances India’s financial influence, especially amid global currency contestations.
Additional measures—such as raising the limit for loans against shares to Rs 1 crore, enabling investment of surplus Special Rupee Vostro Account balances in corporate bonds, and widening currency benchmarking—will deepen capital markets, enhance liquidity, and improve foreign participation confidence.
Conclusion
The Buildathon and RBI reforms, though sectorally distinct, serve a shared national objective: building a self-reliant, innovation-driven, globally confident India. While one invests in future innovators and inclusive talent pipelines, the other strengthens the institutional financial ecosystem needed to support economic expansion and regional leadership. Together, they represent India’s holistic developmental approach—nurturing minds, empowering markets, and globalising national capabilities in pursuit of Viksit Bharat.
Corporate Average Fuel Efficiency (CAFE) 3 Norms

- 03 Oct 2025
In News:
- India has proposed the Corporate Average Fuel Efficiency (CAFE) 3 norms, drafted by the Bureau of Energy Efficiency (BEE), aiming to tighten fuel efficiency standards, reduce vehicular emissions, and promote electric and alternative fuel vehicles.
- First introduced in 2017, CAFE norms regulate fuel consumption and CO? emissions for passenger vehicles weighing up to 3,500 kg, including petrol, diesel, CNG, LPG, hybrid, and electric vehicles.
- The earlier iteration, CAFE 2 (2022-23), capped fuel consumption at 4.78 litres/100 km and CO? emissions at 113 g/km, with penalties for non-compliance.
Need for CAFE 3
Current Indian norms inadvertently favourheavier vehicles like SUVs while imposing stringent targets on smaller cars, unlike international practices in the USA, EU, China, and Japan, where light vehicles enjoy relaxed emission standards. CAFE 3 seeks to align India with global best practices, revive the small car segment, and incentivisegreen mobility, particularly electric vehicles (EVs) and hybrids.
Key Features of CAFE 3 Norms
1. Applicability
- Targets M1 category passenger vehicles (seating up to nine people, maximum weight 3,500 kg).
- Non-compliance will attract penalties under the Energy Conservation Act, 2001.
2. Efficiency Targets
- Efficiency formula: [0.002 × (W – 1170) + c], measured in petrol-equivalent litres/100 km, where W is fleet weight, 1,170 kg is a fixed constant, 0.002 is a multiplier, and ‘c’ decreases yearly from 3.7264 (FY28) to 3.0139 (FY32).
- Lighter vehicles benefit from easier compliance, motivating manufacturers to focus on small cars.
- Additional relaxation: 3.0 g CO?/km (capped at 9 g/km) for compact cars (<909 kg, ≤1200 cc engine, ≤4,000 mm length).
3. Incentives for EVs and Alternative Fuels
- Super credits: Each EV sold counts three times toward fleet compliance; plug-in hybrids 2.5×, strong hybrids 2×, flex-fuel ethanol vehicles 1.5×.
- Carbon Neutrality Factor (CNF): Offers relaxation based on fuel type (e.g., E20–E30 petrol vehicles 8% CNF; strong hybrids 22.3%).
4. Emissions Pooling
- Up to three manufacturers can form a pool, treated as a single entity for compliance.
- Pool managers are legally responsible for penalties, allowing strategic partnerships, cost-sharing, and smoother adherence to targets.
Policy Complementarities
- GST reforms (GST 2.0) reduced taxes on small cars from 28% to 18%, complementing the relaxation measures under CAFE 3.
- By incentivisingEVs, hybrids, and small vehicles, the norms aim to reduce oil import dependency and advance India’s climate commitments under the Paris Agreement.
Challenges
- Industry adaptation: Transitioning fleets to comply with stricter norms while managing costs.
- Consumer acceptance: Affordability and infrastructure readiness for EVs and hybrids.
- Infrastructure readiness: Charging and fuel infrastructure for alternative vehicles needs significant expansion.
Conclusion
CAFE 3 represents a transformative step in India’s vehicular emission regulation, combining fuel efficiency improvements, emission reductions, and green mobility incentives. By aligning with global practices, reviving the small car segment, and encouraging electric and hybrid vehicles, the norms have the potential to accelerate sustainable transportation while addressing environmental and energy security goals. Successful implementation will require coordinated action between manufacturers, policymakers, and consumers to build a cleaner, efficient, and resilient automotive sector in India.
Reimagining Green Economy through Landscapes
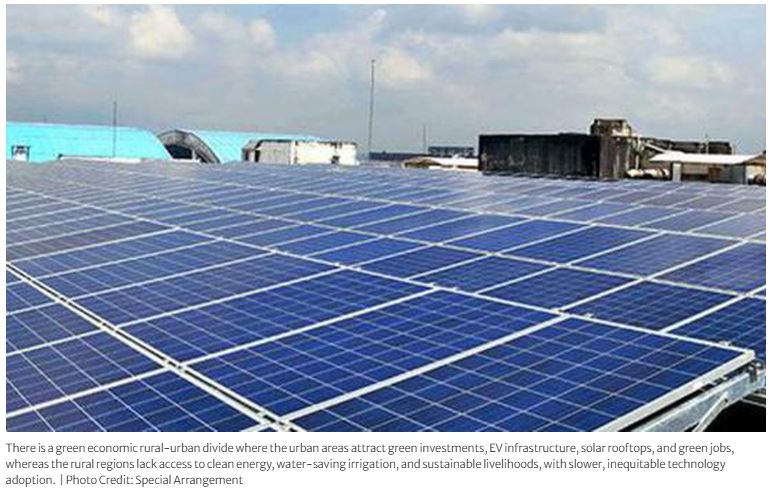
- 02 Oct 2025
In News:
India stands at a critical juncture where the pursuit of economic growth must align with environmental sustainability. The transition to a green economy offers an opportunity to reshape the country’s development paradigm—one that integrates ecological balance, inclusive livelihoods, and technological innovation within a landscape-driven framework.
India’s Green Economy: Growth and Scope
India’s bioeconomy has expanded remarkably from $10 billion in 2014 to $165.7 billion in 2024, growing sixteenfold and accounting for 4.25% of the national GDP. This growth, driven by over 10,000 bio-based start-ups, spans biofuels, bioplastics, pharmaceuticals, and bioinformatics. The industrial bioeconomy contributes nearly half the sectoral share, while India’s achievements—such as 20% ethanol blending in petrol and becoming the third-largest pharmaceutical producer by volume—reflect the scale of progress.
A green economy, however, extends beyond bio-based industries. It encompasses low-carbon growth, circular resource use, ecosystem restoration, and inclusive employment. By 2030, it is estimated to create 35 million green jobs, strengthening India’s resilience against climate shocks and enhancing energy security under Aatmanirbhar Bharat.
Challenges in the Green Transition
Despite this momentum, India’s green growth exhibits deep regional and socio-economic disparities. Urban centers like Maharashtra, Karnataka, and Gujarat dominate green investments, while the North-Eastern and tribal states contribute less than 6% despite abundant natural resources. This spatial imbalance mirrors unequal access to clean energy, irrigation, and digital infrastructure.
Simultaneously, energy transition dilemmas persist. While renewables are expanding, fossil fuel subsidies—still around 40%—undermine emission reduction efforts. In agriculture, solar pump deployment risks groundwater depletion, highlighting the complexity of balancing environmental and livelihood goals. Hard-to-abate sectors such as steel, cement, and power, which contribute nearly 23% of GHG emissions, face prohibitive costs for green technologies—often four times higher than conventional alternatives.
Social inclusion remains another challenge. Women hold only 11% of rooftop solar jobs, and their share in technical green roles is as low as 1–3%. Similarly, tribal and marginalised communities remain passive beneficiaries rather than active stakeholders in climate action.
Reimagining the Green Economy through Landscapes
A landscape-based approach can make India’s green transition more inclusive and ecologically coherent. Landscapes represent interconnected systems of land, water, biodiversity, and human activity. Integrating these systems through participatory planning—from village to national level—can enhance ecosystem services such as air and water regulation, soil fertility, and climate moderation.
Institutionally, leveraging 2.5 lakh Panchayati Raj Institutions (PRIs) and 12 million women-led Self-Help Groups (SHGs) can embed community ownership into green initiatives. Promoting tribal-led bioeconomy models based on non-timber forest produce, agro-waste reuse, and medicinal flora can align conservation with livelihoods.
Technology and fiscal innovation must complement this vision—through green budgeting, public procurement of sustainable products, and expansion of 5G/6G labs for greening digital infrastructure. Decentralised waste management and circular economy practices are vital, especially as urban areas generate 75% of India’s solid waste.
Conclusion
India’s green transformation must evolve from a sectoral to a landscape-driven, community-based model that harmonises economic growth with ecological integrity. Empowering local institutions, mainstreaming gender, and integrating traditional knowledge with modern innovation will be crucial to achieving a just and resilient green future. By 2047, the goal should not merely be higher GDP, but ecological regeneration, social equity, and global climate leadership.
Inflation: A Double-Edged Sword for Economic Growth and Fiscal Stability

- 30 Sep 2025
In News:
Inflation, the sustained rise in general price levels, remains one of the most debated macroeconomic phenomena. While high inflation erodes purchasing power and destabilizes economies, moderate and predictable inflation is often considered essential for sustained growth and fiscal stability. Its impact, however, varies depending on the broader economic context and the balance between price stability and growth objectives.
Understanding Inflation and Its Role
Economists typically define inflation as a result of “too much money chasing too few goods.” Moderate inflation signals expanding demand and healthy economic activity, while very high or negative inflation (deflation) indicates structural imbalances. Central banks, such as the U.S. Federal Reserve and the Reserve Bank of India (RBI), usually target a low but positive inflation rate — around 2% — to maintain price stability and incentivize investment.
Mild inflation helps prevent deflation, which discourages spending and investment as consumers postpone purchases in anticipation of falling prices. The British economist John Maynard Keynes argued that a small amount of inflation encourages consumption, supports employment, and sustains aggregate demand. This aligns with the concept of the Phillips Curve, which once suggested a trade-off between inflation and unemployment, though the relationship has weakened in recent decades.
Economic Benefits of Moderate Inflation
A modest level of inflation can stimulate economic activity when idle capacity and underutilized labor exist. Rising prices encourage producers to expand output, generating more employment and income. Borrowers, including businesses and households, also benefit since debts can be repaid with “cheaper” money, thus encouraging borrowing and spending. Fixed-rate homeowners and long-term debtors gain, as the real value of their obligations declines over time.
For governments, inflation contributes positively to nominal GDP growth, the key denominator in fiscal ratios such as the debt-to-GDP ratio and fiscal deficit. Higher nominal GDP, driven partly by price growth, increases tax collections and helps meet revenue and deficit targets. Hence, inflation, within manageable limits, supports both macroeconomic stability and fiscal sustainability.
Challenges of High or Low Inflation
Excessive inflation, however, leads to declining real incomes, uncertainty, and reduced investment. Rising input and borrowing costs can trigger stagflation — a combination of stagnant growth and high inflation. On the other hand, very low inflation, as seen in India recently with CPI inflation at 2.07% (August 2025) and WPI at 0.52%, presents a different set of challenges.
While subdued prices benefit consumers, they constrain the government’s fiscal arithmetic. Lower inflation suppresses nominal GDP growth — the sum of real growth and inflation — reducing tax revenue growth and widening fiscal gaps. The Union Budget 2025–26 projected nominal GDP growth at 10.1%, but with low price levels, actual growth has trailed this target, weakening revenue collection and straining fiscal balances.
Moreover, persistently low inflation can reflect weak demand and investment sentiment. Although corporate profits have risen due to falling input costs, private capital expenditure remains sluggish, suggesting that firms are not reinvesting profits into productive capacity — a sign of demand-side weakness rather than efficiency gains.
Conclusion
Inflation’s impact on an economy depends on its source, magnitude, and persistence. Moderate inflation supports economic dynamism, government finances, and debt sustainability. However, extremes on either side — hyperinflation or deflation — can destabilize the macroeconomic framework. For India, the policy challenge lies in maintaining a delicate balance: ensuring that inflation stays within the target range to protect consumers while sustaining enough price growth to support investment, job creation, and fiscal health.
Rising State Debt in India: CAG’s Decadal Analysis and Fiscal Implications
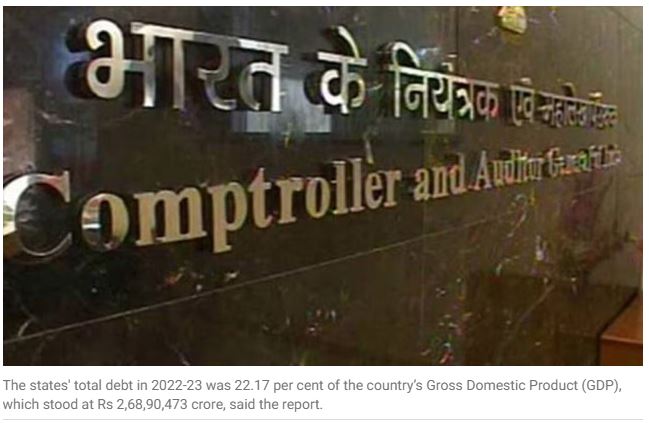
- 22 Sep 2025
In News:
The Comptroller and Auditor General (CAG) of India has released a first-of-its-kind decadal report (2013–14 to 2022–23) analysing the fiscal health of Indian states, highlighting a worrying surge in public debt and its implications for fiscal sustainability and cooperative federalism.
Understanding Public Debt
- Public debt arises when government expenditure exceeds revenue from taxes and other receipts, prompting borrowing to bridge the fiscal gap. For states, such debt includes liabilities under the Consolidated Fund of the State, comprising internal debt and loans and advances from the Centre.
- Internal debt consists of marketable securities like government bonds and treasury bills, and non-marketable debt such as loans from financial institutions like LIC and NABARD or the Reserve Bank’s Ways and Means Advances (WMA).
- The Debt-to-GSDP ratio is a key indicator of fiscal sustainability, reflecting a state’s capacity to service its debt. A higher ratio implies greater fiscal stress.
- The NK Singh Committee on FRBM (2016) recommended a combined general government debt ceiling of 60% of GDP — 40% for the Centre and 20% for states.
Key Findings of the CAG Report
- The CAG report reveals that the aggregate public debt of 28 states trebled over the past decade — from ?17.57 lakh crore in 2013–14 to ?59.60 lakh crore in 2022–23.
- As a share of combined GSDP, debt rose from 16.66% to 22.96%, with state debt accounting for 22.17% of India’s GDP in FY 2022–23.
Inter-State Variations
Fiscal vulnerability varies widely:
- Highest debt-to-GSDP ratios: Punjab (40.35%), Nagaland (37.15%), and West Bengal (33.70%).
- Lowest ratios: Odisha (8.45%), Maharashtra (14.64%), and Gujarat (16.37%).
As of March 2023, eight states had debt exceeding 30% of GSDP, while six states maintained it below 20%.
Debt Sustainability and Composition
- The states’ debt-to-revenue receipts ratio ranged from 128% (2014–15) to 191% (2020–21), averaging about 150% of total receipts.
- The debt-to-GSDP ratio oscillated between 17–25%, with a sharp rise during the COVID-19 pandemic year (2020–21) due to falling GSDP and increased borrowing for relief and GST compensation.
- Major sources of debt include open market borrowings, RBI advances, institutional loans, and back-to-back loans from the Centre in lieu of GST shortfall and capital assistance.
Fiscal Management Concerns
- The report flags a violation of the “golden rule of borrowing”, which stipulates that governments should borrow only for capital formation, not to finance revenue expenditure.
- Eleven states, including Andhra Pradesh, Punjab, Kerala, and West Bengal, used borrowings to fund current expenses.
- In Andhra Pradesh, only 17% of borrowings went to capital expenditure; in Punjab, 26%.
Such practices threaten fiscal sustainability, crowd out productive investments, and risk pushing states into a debt trap, thereby undermining macroeconomic stability.
Way Forward
- Fiscal Discipline: States must prioritise borrowing for productive infrastructure and avoid financing recurring expenditure.
- Debt Management Reforms:Operationalising the Public Debt Management Agency (PDMA) could ensure transparency and better coordination in debt operations.
- Revenue Strengthening: Enhancing tax buoyancy, rationalising subsidies, and diversifying revenue bases can reduce dependence on central transfers.
- Adherence to FRBM Targets: States should align fiscal deficit and debt ratios with FRBM norms to ensure long-term sustainability.
- Institutional Oversight: Strengthening State Finance Commissions and CAG monitoring can promote accountable and sustainable fiscal federalism.
Conclusion
The surge in state-level debt underscores the growing strain on subnational fiscal capacity. While borrowing is essential for development, unchecked debt accumulation and non-productive spending threaten fiscal stability. Ensuring fiscal prudence, efficient debt management, and adherence to reform frameworks like FRBM are vital to preserving India’s long-term macroeconomic resilience and cooperative federal balance.
WAVES Bazaar 2.0

- 21 Sep 2025
In News:
India’s media and entertainment (M&E) industry is experiencing rapid digital transformation, fueled by rising global collaborations and the growing influence of independent creators. To channel this momentum and establish India as a global content hub, the Ministry of Information and Broadcasting (I&B) launched WAVES Bazaar in January 2025—a first-of-its-kind hybrid content marketplace that connects creators, investors, and distributors across various media segments.
Now entering its second phase, WAVES Bazaar is expanding with AI-driven matchmaking, online pitching sessions, and secure viewing rooms—initiatives aimed at strengthening India’s creative ecosystem and democratizing access for new talent.
About WAVES Bazaar
WAVES Bazaar serves as a digital platform bringing together diverse stakeholders from films, television, animation, gaming, music, radio, advertising, and podcasts. It allows creators to network, pitch ideas, and collaborate with OTT platforms, production houses, distributors, and financiers.
Key Features of the Second Phase
- Online Pitching and Viewing Rooms:Budding creators will now be able to pitch directly to production houses, OTT platforms, and investors through virtual sessions. The addition of secure online viewing rooms will allow content buyers to preview projects safely, ensuring transparency and intellectual property protection.
- AI-Driven Matchmaking and Profiling:Artificial Intelligence will enhance the platform’s efficiency by recommending suitable collaborators—such as financiers, distributors, or genre-specific buyers—based on project details. The system will also support automated profile building, pitch deck creation, and project scoring, guiding creators to improve their market visibility.
- Skill Development and Knowledge Hub:The second phase introduces a knowledge ecosystem comprising webinars and masterclasses by industry experts. These sessions aim to bridge the knowledge gap for emerging creators and provide mentorship on project development, financing, and global trends.
- Global Outreach and Co-Production Opportunities:WAVES Bazaar will expand its international footprint through delegations and participation in global festivals. It also seeks to strengthen co-production treaties with partner countries, promoting cross-border collaboration and investment in India’s creative sectors.
Significance for India’s Creative Economy
The initiative aligns with India’s ambition to become a global content hub by enabling equal opportunities for small and independent creators. It aims to diversify creative exports beyond films into music, gaming, animation, podcasts, and short-form content, while also enhancing India’s soft power and digital cultural economy.
By integrating technology, mentorship, and market access, WAVES Bazaar could emerge as the central gateway for Indian creative exports, fostering innovation and sustainable growth in the sector.
Challenges and Way Forward
While the portal’s potential is immense, its success will depend on addressing data security, ensuring inclusive access for regional creators, and maintaining long-term international partnerships. If implemented effectively, WAVES Bazaar 2.0 can position India as a leading creative powerhouse, bridging the gap between talent and opportunity in the global digital age.
SEBI Announces Major Market Reforms to Enhance Investment and Governance

- 18 Sep 2025
In News:
The Securities and Exchange Board of India (SEBI) recently announced a set of comprehensive reforms aimed at improving foreign investment inflows, easing IPO norms for large issuers, strengthening governance in market infrastructure institutions (MIIs), and promoting financial inclusion. These reforms are introduced amid heightened global uncertainty, with foreign portfolio investors (FPIs) withdrawing over ?63,500 crore from Indian markets since July 2025 due to weak earnings, high valuations, and international trade tensions.
SWAGAT-FI: Single Window Access for Foreign Investors
A cornerstone of SEBI’s reforms is the Single Window Automatic &Generalised Access for Trusted Foreign Investors (SWAGAT-FI) framework, designed to simplify investment access for FPIs and Foreign Venture Capital Investors (FVCIs).
Eligibility and Scope:
- Sovereign wealth funds, central banks, regulated public retail funds (mutual funds, insurance companies, pension funds).
- Existing FPIs meeting criteria can migrate to SWAGAT-FI status.
Features:
- Unified registration and KYC cycle, reducing repeated compliance.
- Exemption from the 50% cap on contributions by NRIs, OCIs, and resident Indians.
- Simplified access through the India Market Access portal, reducing regulatory complexity.
- Implementation over a six-month timeline, aiming to restore investor confidence and enhance India’s global competitiveness.
Relaxed IPO Norms for Large Companies
To encourage large issuers to raise capital efficiently:
- Companies with market capitalization of ?1–5 lakh crore must now offer 2.75–2.8% of post-issue market cap, down from 5%.
- Minimum public offer for mega-IPOs raised to ?6,250 crore.
- Public shareholding timeline relaxed: Firms with <15% float at listing get 10 years to meet 25% minimum, and those with ≥15% float get 5 years.
- Anchor investor quota increased from one-third to 40%, reserving one-third for domestic mutual funds and the rest for life insurers and pension funds.
These measures help promoters reduce immediate dilution while facilitating broad investor participation.
Strengthened Governance in Market Infrastructure Institutions
SEBI has introduced structural reforms to improve transparency and accountability in exchanges and clearing corporations:
- Two executive directors appointed to oversee critical operations (trading, clearing, settlement) and regulatory compliance (risk, investor grievances).
- Defined roles and responsibilities for Managing Directors and Key Managerial Personnel to enhance succession planning.
- Scale-based thresholds introduced for material related-party transactions.
- Separate AIF schemes for accredited investors with flexible compliance norms.
Mutual Fund and Retail Investor Reforms
To promote financial inclusion and investor protection:
- Maximum exit load reduced from 5% to 3%.
- Distributor incentives revised to encourage inflows from B-30 cities and women investors.
- Enhanced transparency in investor reporting and compliance requirements.
Significance and Implications
- For India’s markets: Provides operational flexibility for large issuers, simplifies compliance, and reduces procedural hurdles for trusted foreign investors.
- For global competitiveness: Positions India as a stable, long-term investment hub amid capital volatility.
- For retail investors: Encourages broader participation from smaller cities and underrepresented groups, aligning with inclusive financial growth objectives.
Overall, SEBI’s reforms reflect a balance between market facilitation, investor protection, and governance standards, reinforcing India’s ambition to be an attractive, transparent, and globally competitive capital market.
India’s Export Challenges

- 12 Sep 2025
In News:
India’s merchandise and services exports, once a key driver of economic growth, face mounting challenges amid global protectionism and domestic structural constraints. Recently, the imposition of a 50% tariff by the United States, which accounts for roughly 20% of India’s exports, threatens stagnation in the country’s largest trading partner market, highlighting vulnerabilities in export competitiveness.
Historical Export Trends
Between 1990 and 2010, India’s exports as a share of GDP rose from 7.1% to 20.4%, supported by liberalisation, reforms, and global integration. Merchandise and services exports contributed jointly, with sectors such as textiles, pharmaceuticals, and IT-BPM emerging as strong performers. However, from 2010 to 2024, India’s export growth decelerated; the GDP share dipped to 17.7% by 2020, recovering only marginally to 21.2% by 2024, while India’s global merchandise share rose modestly from 0.51% (1990) to 1.81% (2024). Most of the early gains were concentrated in the first two decades of liberalisation.
Sector-wise performance shows uneven growth: agricultural exports increased from 0.85% to 2.22%, fuel and mining exports surged from 0.32% to 2.62%, led by petroleum, while manufacturing, despite tripling to 1.73%, continues to lag. Services exports have outperformed goods, rising from 2.9% of global share in 2010 to 4.2% in 2024, largely concentrated in IT, telecom, and business services.
Structural Challenges
India’s exports confront multiple structural constraints:
- Tariff Shock from US: The punitive 50% tariffs jeopardise India’s most buoyant market and compound the effects of a global slowdown.
- Competitiveness Erosion: Rising production costs, inefficient logistics, and regulatory complexity reduce India’s global manufacturing edge.
- Overdependence on Services: India’s services exports are twice that of goods, with IT/ITES dominating and other sectors contributing only around 40%.
- Narrow Manufacturing Base: While textiles, pharma, steel, and chemicals perform well, high-value sectors such as electronics, precision machinery, and advanced materials remain underrepresented.
- Global Headwinds: Protectionist policies, reshoring trends, non-tariff barriers, and a weakened WTO dispute settlement system limit India’s options.
Policy Initiatives
Several steps have been undertaken to revive exports:
- Export Promotion Mission (EPM 2025): Sector-specific programs like NiryatProtsahan (credit facilitation) and Niryat Disha (market access, branding, logistics).
- RoDTEP Scheme: Refunds hidden central, state, and local taxes on exports, expanded to steel, pharma, and chemicals.
- Simplified EPCG Scheme: Facilitates duty-free import of capital goods, with eased compliance.
- BHARATI Initiative for Agri-Food Exports: APEDA’s 2025 program to incubate 100 startups with AI quality checks and blockchain traceability.
- E-Commerce Export Hubs: Warehousing, customs clearance, and logistics support for MSMEs.
Way Forward
- Enhance Manufacturing Competitiveness: Improve logistics efficiency (from 13–14% of GDP to global benchmark 8%), integrate with global value chains, and focus on electronics, EVs, green technologies, and semiconductors.
- Diversify Export Markets: Reduce dependence on US/EU markets by targeting Africa, Latin America, and ASEAN; leverage FTAs with UAE, Australia, and UK.
- Deepen Services Export Base: Expand beyond IT to healthcare, tourism, education, financial and creative services.
- Agriculture and Fuels: Promote agro-processing, value addition in petrochemicals, and branded exports.
- Policy and Institutional Support: Advocate WTO reforms, pursue bilateral/multilateral agreements, and incentivise R&D and quality upgradation in MSMEs.
Conclusion
India’s exports face weak merchandise growth, concentrated services reliance, and external shocks such as US tariffs. A multi-pronged strategy—strengthening manufacturing, diversifying markets, deepening services, and fostering value addition—remains critical to reclaim India’s global export momentum and support sustainable economic growth.
Pulses Production in India: Pathways to Atmanirbharta

- 06 Sep 2025
In News:
Pulses hold a unique place in India’s agricultural economy, food security, and nutritional well-being. As a protein-rich staple in largely vegetarian diets, they not only address malnutrition but also contribute to sustainable farming through nitrogen fixation, low water requirements, and reduced carbon emissions. Despite being the world’s largest producer and consumer of pulses, India continues to import sizeable quantities, making self-reliance a critical national goal.
Current Scenario and Progress
India cultivates 12 pulse crops across kharif, rabi, and summer seasons, supported by diverse agro-climatic conditions. Production, however, is highly concentrated—Madhya Pradesh, Maharashtra, and Rajasthan together account for over 55% of total output, while the top 10 states contribute more than 91%.
Historically, the sector suffered from low yields and import dependence. Production declined to 16.35 million tonnes (MT) in 2015–16, forcing imports of nearly 6 MT. However, government interventions such as the National Food Security Mission (NFSM) and higher Minimum Support Prices (MSP) have significantly reversed this trend. By 2022–23, production surged by 59.4% to 26.06 MT, while productivity improved by 38%. Import dependence fell from 29% to just 10.4%, marking substantial progress.
Yet, challenges remain. Nearly 80% of pulses cultivation is rain-fed, leaving it vulnerable to monsoon fluctuations. The sector supports the livelihood of over five crore farmers, making policy stability and targeted support crucial.
NITI Aayog’s Roadmap
Recognising the pivotal role of pulses, NITI Aayog released a report titled “Strategies and Pathways for Accelerating Growth in Pulses towards the Goal of Atmanirbharta” in September 2025. The report projects domestic production to reach 30.59 MT by 2030 and 45.79 MT by 2047, thereby reducing imports and strengthening India’s food sovereignty.
Key Recommendations:
- Area Retention and Diversification – Establish region-specific crop clusters to optimise land use.
- Technology Adoption – Promote customised technologies suited for varied agro-ecological zones.
- Seed Quality and Distribution – Ensure timely availability of high-quality seeds, with special focus on 111 high-potential districts that account for 75% of national output.
- Cluster-Based Hubs – Implement the “One Block–One Seed Village” model through farmer producer organisations (FPOs) to enhance productivity.
- Mission for Atmanirbharta in Pulses – A six-year initiative targeting key crops such as pigeonpea, black gram, and lentil to fast-track self-sufficiency.
According to NITI Aayog, India could achieve self-sufficiency in pulses within the next decade if the current pace of growth is sustained.
Nutritional and Environmental Significance
Pulses are indispensable in addressing India’s protein deficiency and micronutrient gaps, particularly in iron and folate. Their role in combating hidden hunger makes them vital to achieving Sustainable Development Goals (SDGs) related to nutrition.
Environmentally, pulses act as natural soil enrichers through nitrogen fixation, reduce dependence on chemical fertilisers, and have a lower water footprint compared to cereals. Thus, scaling up their production aligns with both climate resilience and sustainable agriculture goals.
Conclusion
India has made commendable progress in reducing import dependence and improving productivity in pulses production over the past decade. However, achieving complete self-sufficiency requires sustained, region-specific strategies, robust seed systems, and technology-driven interventions. NITI Aayog’s roadmap, backed by focused initiatives like the Mission for Atmanirbharta in Pulses, provides a viable pathway.
By 2047, India not only aims to meet its domestic demand but also emerge as a global leader in pulses production—ensuring food security, nutritional well-being, and environmental sustainability for its growing population.
Nari Shakti and India’s Economic Transformation
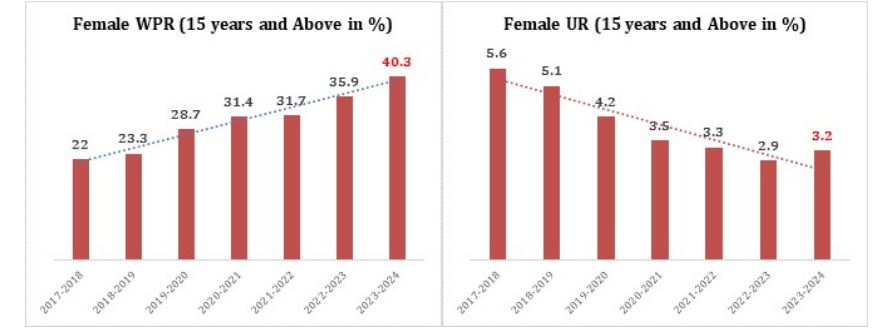
- 27 Aug 2025
In News:
Women’s participation in India’s workforce has witnessed a remarkable turnaround in recent years, emerging as a cornerstone of the country’s economic transformation and a critical driver for the vision of Viksit Bharat 2047.
Data from the Periodic Labour Force Survey (PLFS) shows that the female workforce participation rate (WPR) nearly doubled from 22% in 2017-18 to 40.3% in 2023-24, while the unemployment rate (UR) fell from 5.6% to 3.2% during the same period. This trend reflects not only improved economic opportunities but also the success of multiple policy interventions promoting gender-inclusive growth.
Rising Participation Across Sectors
The surge in women’s employment has been particularly pronounced in rural India, with a 96% rise in female employment, compared to 43% in urban areas. Importantly, self-employment among women grew from 51.9% to 67.4%, showcasing the increasing entrepreneurial orientation of India’s female workforce. Formal employment has also expanded, with 1.56 crore women joining the formal workforce in the last seven years as per EPFO payroll data. Additionally, over 16.6 crore women workers have registered on the e-Shram portal, providing them access to social security schemes.
Education, Employability, and Skills
Employability of women has improved significantly. Reports show that employability among female graduates rose from 42% in 2013 to 47.5% in 2024, while women with postgraduate education saw their WPR increase from 34.5% to 40% between 2017 and 2024. The India Skills Report 2025 projects that more than half of Indian graduates will be globally employable, marking a substantial improvement in skill readiness.
Policy Push for Women-Led Development
Government initiatives have been central to this transformation. The gender budget increased by 429% in the last decade, reaching ?4.49 lakh crore in FY 2025-26, supporting more than 70 central schemes and 400 state-level initiatives targeted at female entrepreneurship and welfare.
Flagship programmes like Startup India have created a thriving ecosystem where nearly half of DPIIT-registered startups have at least one-woman director. Schemes such as PM Mudra Yojana (with women receiving 68% of 35.38 crore loans worth ?14.72 lakh crore) and PM SVANidhi (where 44% of beneficiaries are women) have provided critical financial inclusion. Complementary initiatives like Namo Drone Didi, Deendayal Antyodaya Yojana–NRLM, and the Lakhpati Didi scheme are equipping women with resources to become economically self-reliant.
Women-Led MSMEs and Job Creation
The rise of women-led MSMEs further reflects this shift. Their number almost doubled from 1 crore in 2010-11 to 1.92 crore in 2023-24, generating 89 lakh additional jobs for women between FY21–FY23. The share of women-owned establishments grew from 17.4% to 26.2% in the same period. This expansion highlights the growing role of women as both job creators and drivers of inclusive growth.
Towards Viksit Bharat 2047
Women are no longer seen as mere beneficiaries of welfare schemes but as leaders of India’s growth story. From rural entrepreneurs to corporate directors, their contributions are reshaping the economy. Achieving the vision of 70% women workforce participation by 2047 is now integral to India’s developmental roadmap.
Conclusion
India is undergoing a paradigm shift from women’s development to women-led development. The surge in women’s employment, financial inclusion, and entrepreneurship reflects both a social transformation and an economic imperative. As Nari Shakti takes centre stage, empowering women through education, skills, and supportive policies will be crucial for India to achieve inclusive and sustainable growth on its path to Viksit Bharat.
Medical Tourism in India

- 10 Aug 2025
In News:
India has emerged as one of the leading destinations for medical tourism, attracting foreign patients due to its cost-effective treatments, advanced healthcare infrastructure, and traditional wellness systems. The surge in foreign tourist arrivals (FTAs) for medical purposes highlights the sector’s growing role in India’s economy, diplomacy, and healthcare landscape.
Current Trends in Medical Tourism
- Between January–April 2025, India recorded 1,31,856 medical FTAs, accounting for 4.1% of total FTAs in this period.
- In 2024, medical FTAs stood at 6.44 lakh, a sharp increase from 1.82 lakh in 2020, indicating robust growth despite global pandemic disruptions.
- Top source countries (2024):
- Bangladesh – 4.82 lakh arrivals (largest contributor).
- Iraq – 32,008 arrivals.
- Somalia – 11,717 arrivals.
- Oman – 10,431 arrivals.
- Uzbekistan – 8,921 arrivals.
This surge reflects both India’s healthcare competitiveness and rising global demand for affordable, high-quality treatment.
Why India attracts Medical Tourists
- Affordability & Quality – Advanced medical procedures at a fraction of Western costs.
- Specialised Expertise – Strong presence in cardiology, orthopaedics, oncology, organ transplants, and IVF.
- Traditional Wellness – Ayurveda, Yoga, and naturopathy complement allopathic care, attracting wellness tourists.
- Regulatory Support – Extension of e-Medical visa and attendant visa facilities to 171 countries, easing travel for patients.
- Integrated Ecosystem – Hospitals, facilitators, hotels, airlines, and regulatory bodies work together under the ‘Heal in India’ initiative.
Government Initiatives
- National Efforts:
- ‘Heal in India’ campaign (Ministry of Health & Family Welfare) promoting India as a global healthcare hub.
- Encouraging public-private partnerships (PPP) to expand hospital capacity, improve service delivery, and enhance medical infrastructure.
- Branding and showcasing India’s medical expertise at international platforms.
- Visa Facilitation:E-medical visa/e-medical attendant visa for 171 countries to smoothen entry of international patients.
- State-level Initiatives (Case Study: Gujarat):
- Registration of wellness retreats on official tourism websites.
- Participation in global health & wellness exhibitions, seminars, and conferences.
- Familiarisation trips (FAM) for industry stakeholders to promote wellness centres.
- Training paramedical staff to improve quality of care for foreign patients.
- Use of social media and global outreach to project Gujarat’s health infrastructure and wellness potential.
Economic & Strategic Significance
- Foreign Exchange Earnings – Growing inflows from high-value medical travellers.
- Employment Generation – Creation of jobs in healthcare, tourism, and allied sectors.
- Soft Power & Health Diplomacy – India’s outreach in medical care strengthens its global image and fosters bilateral goodwill, especially with neighbouring and developing countries.
- Regional Leadership – With Bangladesh, Iraq, and African nations as major contributors, medical tourism strengthens India’s role as a regional healthcare hub.
Challenges
- Uneven distribution of healthcare infrastructure across states.
- Regulatory concerns regarding quality assurance in smaller hospitals and clinics.
- High dependence on a few source countries.
- Competition from emerging medical tourism destinations like Thailand, Singapore, and Turkey.
Way Forward
- Standardisation& Accreditation – Enforcing global quality standards across hospitals to build trust.
- Digital Integration – Expanding telemedicine, AI-based diagnostics, and digital health records for seamless cross-border care.
- Wellness Tourism Synergy – Combining allopathic treatments with Ayush-based wellness offerings.
- Infrastructure Development – Strengthening airports, medical hubs, and hospitality sectors near healthcare clusters.
- Diversification of Source Countries – Targeting Africa, Middle East, and Latin America for expansion.
Conclusion
India’s medical tourism sector is a sunrise industry, merging healthcare excellence with tourism potential. With over 1.3 lakh medical FTAs in early 2025 alone, the sector underscores India’s strength as a global healthcare destination. By addressing challenges and scaling up initiatives like ‘Heal in India’, India can transform medical tourism into a key pillar of economic growth, soft power, and international diplomacy.
Ethanol Blending

- 07 Aug 2025
Introduction:
India has achieved a significant milestone in its clean energy transition by rolling out E20 fuel (20% ethanol blended petrol) nationwide in 2025, five years ahead of the original 2030 target. The initiative aligns with the Ethanol Blended Petrol (EBP) Programme, launched in 2003, and marks a sharp rise from just 1.5% ethanol blending in 2014 to 20% in 2025.
The policy aims to enhance energy security, reduce carbon emissions, cut crude oil imports, and support farmers. However, concerns have emerged regarding its impact on vehicle performance, consumer costs, and technical feasibility.
Ethanol Blending: Policy Context
- Nature of Fuel: Ethanol is an alcohol-based biofuel derived mainly from sugarcane, maize, and biomass.
- Benefits:
- Reduces dependency on crude imports (saving ~?1.36 lakh crore in foreign exchange).
- Provides ?1.18 lakh crore to farmers, boosting rural incomes.
- Cuts CO? emissions by ~698 lakh tonnes.
- Strengthens domestic biofuel industry (ethanol production rose from 38 crore litres in 2014 to 661 crore litres in 2025).
- Global Context: Ethanol blending is used in several countries (e.g., USA, Brazil) to curb fossil fuel reliance.
Economic and Environmental Gains
- Macroeconomic Benefits:
- Estimated to lower crude oil imports by ?50,000 crore annually.
- Strengthened India’s energy self-reliance under the National Bio-Energy Programme.
- Environmental Benefits:
- Lower greenhouse gas emissions.
- Promotion of renewable energy use.
- Agricultural Support: Higher demand for sugarcane and related feedstock increases farmer incomes.
Challenges and Concerns
1. Vehicle Compatibility Issues
- Vehicles manufactured before April 2023 are not designed for E20 and risk damage.
- Hero MotoCorp & TVS highlight the need to replace rubber, elastomer, and plastic components (e.g., gaskets, O-rings, fuel tubes) with ethanol-compatible materials.
- Ethanol’s corrosive nature leads to:
- Metal corrosion (fuel tanks, injectors, exhausts).
- Degradation of rubber/plastic parts.
- Moisture absorption (phase separation in fuel).
- Altered air-fuel ratio causing knocking, poor combustion, and reduced performance.
2. Drop in Fuel Efficiency
- Government stance: Mileage loss is “marginal” (1–2% for calibrated vehicles; 3–6% for others), reducible by engine tuning.
- Independent experts: Real-world mileage drop may be 6–7%, raising consumer costs.
- Many consumers report higher fuel consumption, sluggish acceleration, and reduced efficiency in older vehicles.
3. Consumer Concerns
- Rising fuel expenses due to frequent refuelling.
- Lack of consumer choice between E20 and pure petrol.
- Demand for awareness campaigns and clear labelling at fuel stations.
Industry and Policy Response
- Automobile manufacturers are producing E20-compliant vehicles since April 2023.
- Retrofitting advisories issued for older models.
- Government maintains that minor modifications (rubber part replacements, engine recalibration) can mitigate risks at low costs.
Future Outlook: Beyond E20
- Discussions are underway on higher blends (E30, E40).
- Experts warn of greater risks:
- More severe corrosion and efficiency loss.
- Need for dual fuel dispensing infrastructure.
- Retrofitting or phased replacement of older vehicles.
- Policy direction must balance energy security goals with consumer interests.
Conclusion
The rollout of E20 fuel represents a major stride in India’s path toward sustainable energy and reduced import dependence. However, the transition is accompanied by technical, economic, and consumer-level challenges, particularly for pre-2023 vehicles.
Going forward, India’s ethanol blending strategy must ensure:
- Consumer awareness and choice.
- Targeted retrofitting supportfor older vehicles.
- Sustainable ethanol production without compromising food security or causing ecological stress.
Balancing macroeconomic and environmental gains with micro-level consumer impacts will determine the long-term success of India’s ethanol blending programme.
The Role of ‘Invisible’ Trade in India’s Foreign Exchange Earnings
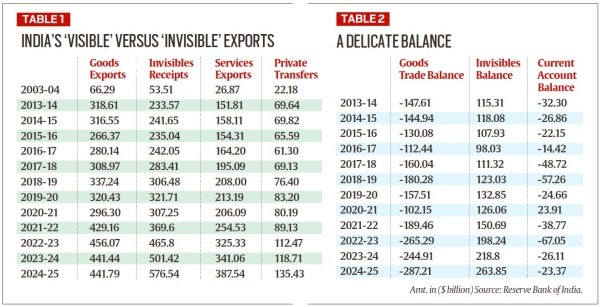
- 11 Jul 2025
In News:
India's foreign trade landscape has undergone a fundamental transformation, with "invisible" trade—comprising services exports and private remittance inflows—emerging as a dominant contributor to foreign exchange earnings. Traditionally, international trade is associated with the export and import of physical goods. However, the increasing weight of intangibles such as services and remittances has positioned India as the “office of the world” in contrast to China’s role as the “factory of the world.”
Trends in India’s Visible vs Invisible Trade
India’s merchandise exports rose from $66.3 billion in 2003–04 to $456.1 billion in 2022–23, before dipping slightly to $441.8 billion in 2024–25. While goods exports have fluctuated with global economic cycles, invisibles have exhibited resilient and consistent growth.
- Invisible receipts increased from $53.5 billion in 2003–04 to $233.6 billion in 2013–14, and further to $576.5 billion in 2024–25.
- In 2024–25, invisible receipts exceeded merchandise exports by $135 billion, reversing the trend from a decade earlier.
Composition of Invisible Earnings
- Services Exports:
- Valued at $387.5 billion in 2024–25, up from $26.9 billion in 2003–04.
- Software services remain dominant ($180.6 billion), but significant growth has also been noted in business, financial, and communication services ($118 billion).
- Private Transfers (Remittances):
- Amounted to $135.4 billion in 2024–25, up from $22.2 billion in 2003–04.
- Reflects the export of Indian human capital, with inflows from expatriates, especially in the Gulf and North America.
Economic Significance
- Current Account Management: India’s merchandise trade deficit ballooned to $287.2 billion in 2024–25, but this was substantially offset by a net invisible surplus of $263.8 billion, keeping the current account deficit at $23.4 billion, lower than 2013–14 levels.
- Geopolitical Immunity: Invisible earnings have remained relatively insulated from global trade tensions, protectionist tariffs, and geopolitical shocks. Unlike goods trade, services have not been significantly impacted by events such as the pandemic or global conflicts.
- Limited Policy Support, High Impact: Despite minimal reliance on FTAs, tariff negotiations, or production-linked incentives, invisibles have flourished—highlighting the natural comparative advantage India holds in the global services and remittances market.
Comparison with China
China recorded a merchandise trade surplus of $768 billion in 2024, but faced a deficit of $344.1 billion on the invisibles front. In contrast, India posted a services trade surplus of $188.8 billion, emphasizing its role as a global service hub rather than a manufacturing powerhouse.
Conclusion
India’s foreign trade narrative has shifted decisively towards intangible exports. With robust growth in services and remittances, invisibles have become the invisible hand stabilizing India’s external sector. For sustained macroeconomic resilience, policymakers must now institutionalize support for the services sector, facilitate human capital mobility, and leverage digital infrastructure to enhance India’s global footprint in knowledge-based trade.
India’s Emerging Equity Model
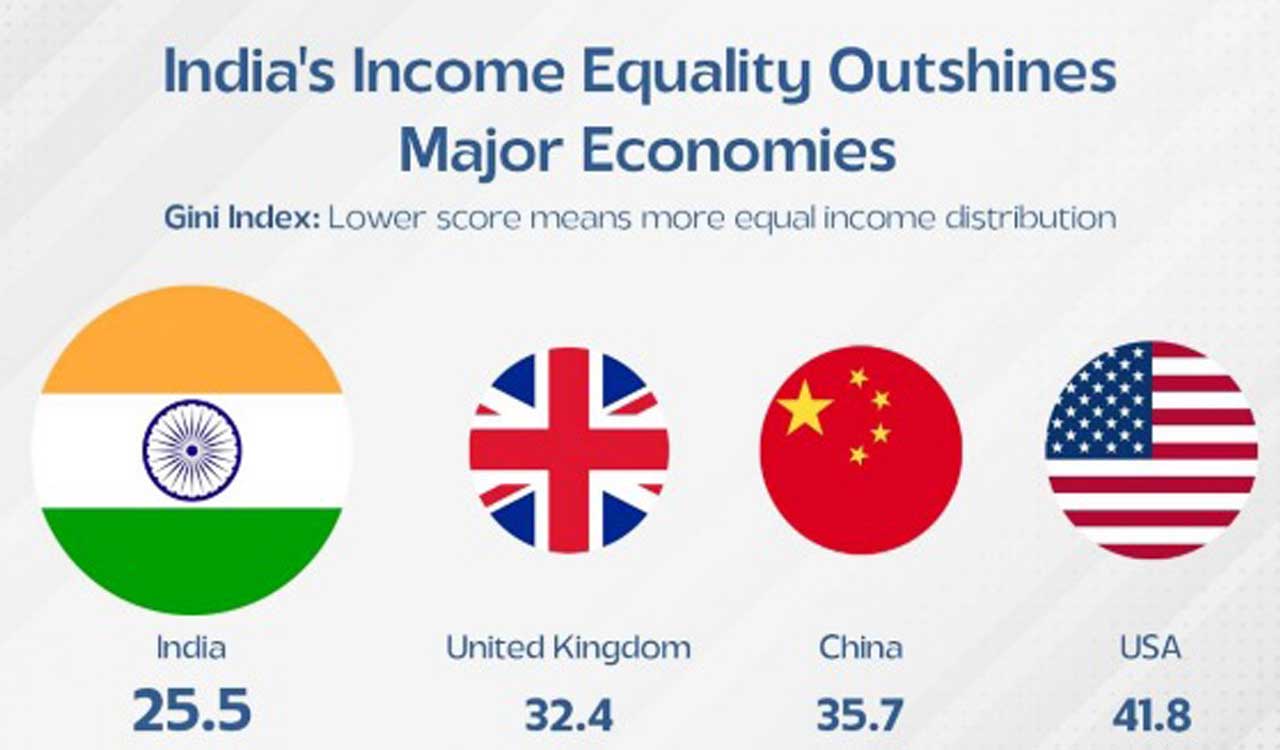
- 09 Jul 2025
In News:
According to the World Bank’s latest estimates, India has emerged as the fourth most income-equal country in the world, registering a Gini Index of 25.5 in 2022–23. This significant milestone places India just behind the Slovak Republic, Slovenia, and Belarus, surpassing many advanced and developing economies in income equality.
This achievement is paralleled by a sharp decline in extreme poverty—from 16.2% in 2011–12 to 2.3% in 2022–23—with over 171 million people lifted out of poverty in the past decade. It reflects the combined impact of sustained economic growth and the Indian state’s proactive welfare architecture.
Understanding the Gini Index and India’s Ranking
The Gini Index measures income inequality on a scale from 0 (perfect equality) to 100 (maximum inequality). With a score of 25.5, India falls into the "moderately low inequality" bracket (25–30), indicating a fair distribution of income. This is in sharp contrast to countries like China (35.7) and the United States (41.8). India's position is particularly noteworthy given its population size and diversity.
Poverty Reduction as a Catalyst for Equality
A key driver of this improved equality has been the drastic reduction in poverty, based on the World Bank’s threshold of $2.15/day (PPP). The decline to 2.3% extreme poverty signals successful poverty alleviation through targeted welfare, representing one of the most remarkable social transitions globally in the last decade.
Government Schemes and Inclusive Interventions
India’s equity gains are not accidental but the result of well-designed and executed social policies, supported by digital infrastructure and targeted delivery.
1. Financial Inclusion and DBT
- PM Jan Dhan Yojana enabled over 55 crore bank accounts, promoting financial access across rural and urban populations.
- Aadhaar-linked Direct Benefit Transfers (DBT) reduced leakages, saving ?3.48 lakh crore by March 2023.
2. Health Security: Ayushman Bharat provides ?5 lakh insurance coverage, with over 41 crore beneficiaries enhancing access to secondary and tertiary healthcare.
3. Food Security: PM Garib Kalyan Anna Yojana (PMGKAY) ensured food availability to 80 crore people during COVID-19 and beyond, securing nutrition and resilience.
4. Livelihood Support: Stand-Up India and PM Vishwakarma Yojana support entrepreneurship, skilling and credit access for SCs, STs, women, and traditional artisans.
A Model of Equity-Oriented Growth
India has demonstrated that inclusive digital governance, if integrated with fiscal discipline and political will, can lead to tangible socioeconomic transformation. The convergence of growth, inclusion, and resilience sets a strong foundation for social equity.
A Social Welfare Department official aptly noted, “The Gini Index of 25.5 reflects real change—better access to jobs, food, healthcare, and dignity.”
Global Context and India’s Unique Approach
Unlike Scandinavian countries that rely on entrenched welfare states, India’s equality model stems from scalable digital infrastructure, direct cash transfers, and community-centric schemes. Among 167 countries surveyed, India’s outcome stands as a beacon for other developing nations striving to achieve balanced and sustainable development.
Employment-Linked Incentive (ELI) Scheme
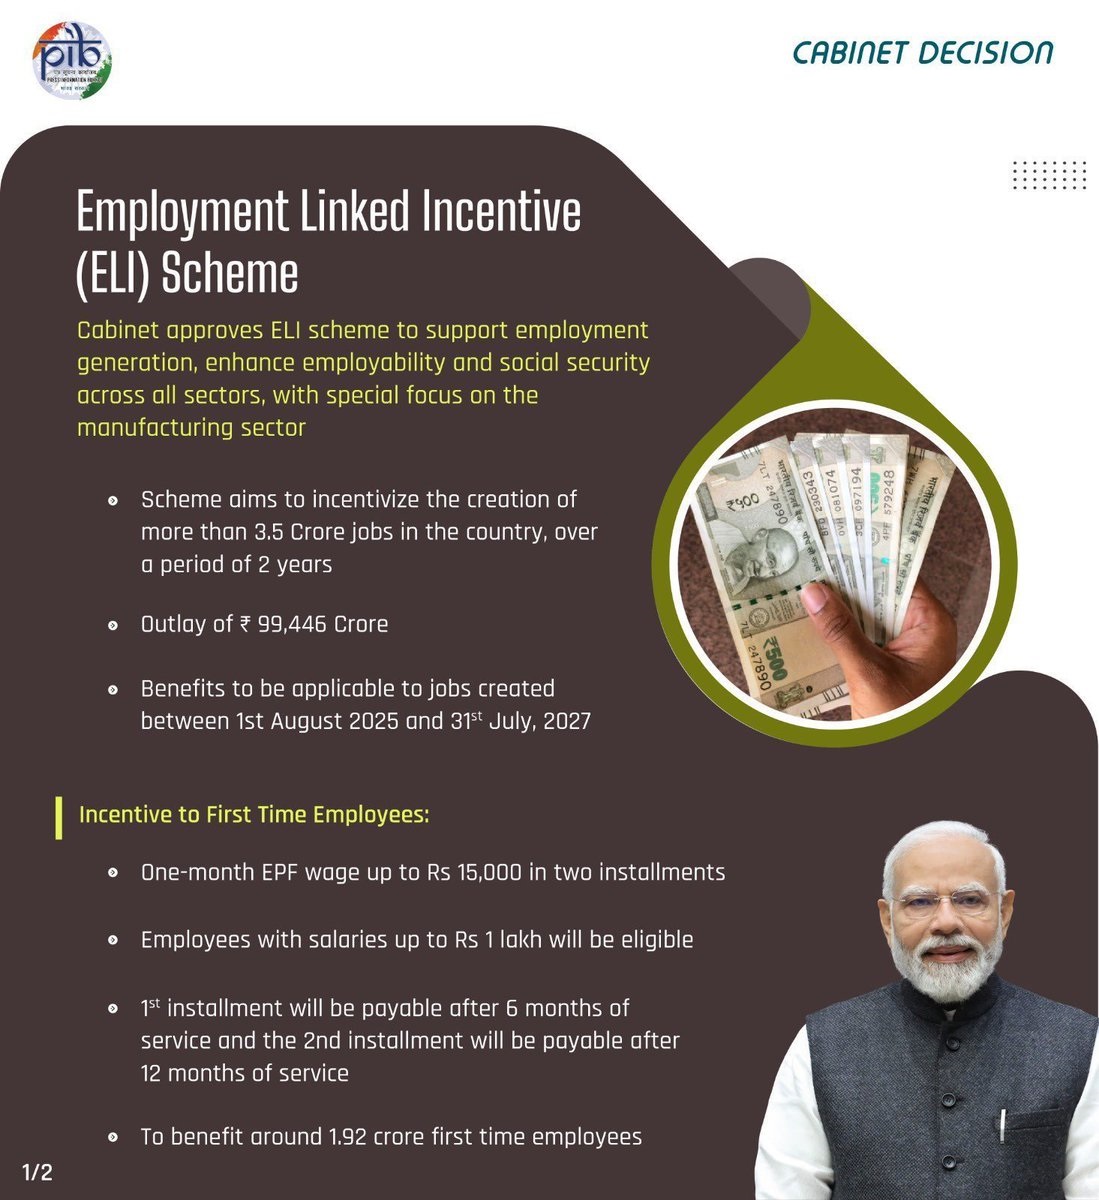
- 07 Jul 2025
In News:
The Government of India has approved the Employment-Linked Incentive (ELI) Scheme with an outlay of ?99,446 crore, aimed at promoting formal employment generation, particularly in the manufacturing sector. Announced in the 2024–25 Union Budget, the scheme is part of a broader employment strategy that includes internships, skill development, and youth engagement initiatives.
Key Features of the Scheme
The ELI scheme, operational from August 1, 2025 to July 31, 2027, targets the creation of over 3.5 crore jobs. Of these, 1.92 crore newly employed individuals are expected to benefit directly. It is being implemented through the Employees Provident Fund Organisation (EPFO).
For eligible new recruits earning up to ?1 lakh/month:
- EPFO will transfer one month’s EPF wage (up to ?15,000) in two instalments—after 6 and 12 months of continuous service.
- Part of the incentive will be deposited in a fixed savings instrument, withdrawable later by the employee.
Incentives for employers include:
- ?3,000 per employee/month for two years for each new employee retained for at least six months.
- For the manufacturing sector, this benefit may extend into the third and fourth years.
Who Benefits?
The scheme primarily benefits:
- New entrants into the formal labour market.
- Labour-intensive sectors, especially manufacturing.
- Employers incentivized to sustain job creation.
- Small businesses, if implementation is expanded inclusively.
Industry Response
The industry has largely welcomed the initiative. According to FICCI’s former president, it is an “innovative” step that rewards both employees and employers. The Confederation of Indian Industry (CII) noted its potential to reshape India’s employment architecture.
However, Laghu Udyog Bharati, representing micro and small businesses, emphasized the need to include units with less than 20 employees, which dominate India’s enterprise landscape. Entrepreneurs’ associations also called for simplified and direct reimbursement models linked to verified payroll data, particularly under the MSME Ministry.
Trade Union Perspectives
While the Bharatiya Mazdoor Sangh (BMS) cautiously endorsed the scheme, other central trade unions criticized it for allegedly favoring corporates. They compared it to the Production-Linked Incentive (PLI) Scheme of 2020, where funds reportedly failed to create jobs and ended up benefiting large firms. Unions have demanded expansion of social security coverage and improved quality of employment, rather than subsidizing private sector wage bills.
Concerns and Challenges
Key concerns include:
- The role of EPFO, traditionally a custodian of worker savings, now being tasked with implementing a government-funded job creation scheme.
- Lack of clarity on fund disbursement responsibilities, raising doubts over accountability and oversight.
- Fear of misuse, given past precedents of incentive leakage.
- The structural issue of economic slowdown and stagnant worker incomes, which the scheme doesn’t directly address.
Conclusion
The ELI Scheme is a bold intervention in India’s formal employment landscape, combining wage subsidies with retention incentives. However, for it to be truly transformative, it must ensure inclusive coverage, maintain transparency, and be integrated into a broader strategy that enhances domestic demand and quality of employment. As India aims for equitable economic growth, effective implementation and stakeholder trust will be critical to its success.
Statistical Report on Value of Output from Agriculture and Allied Sectors (2011–12 to 2023–24)
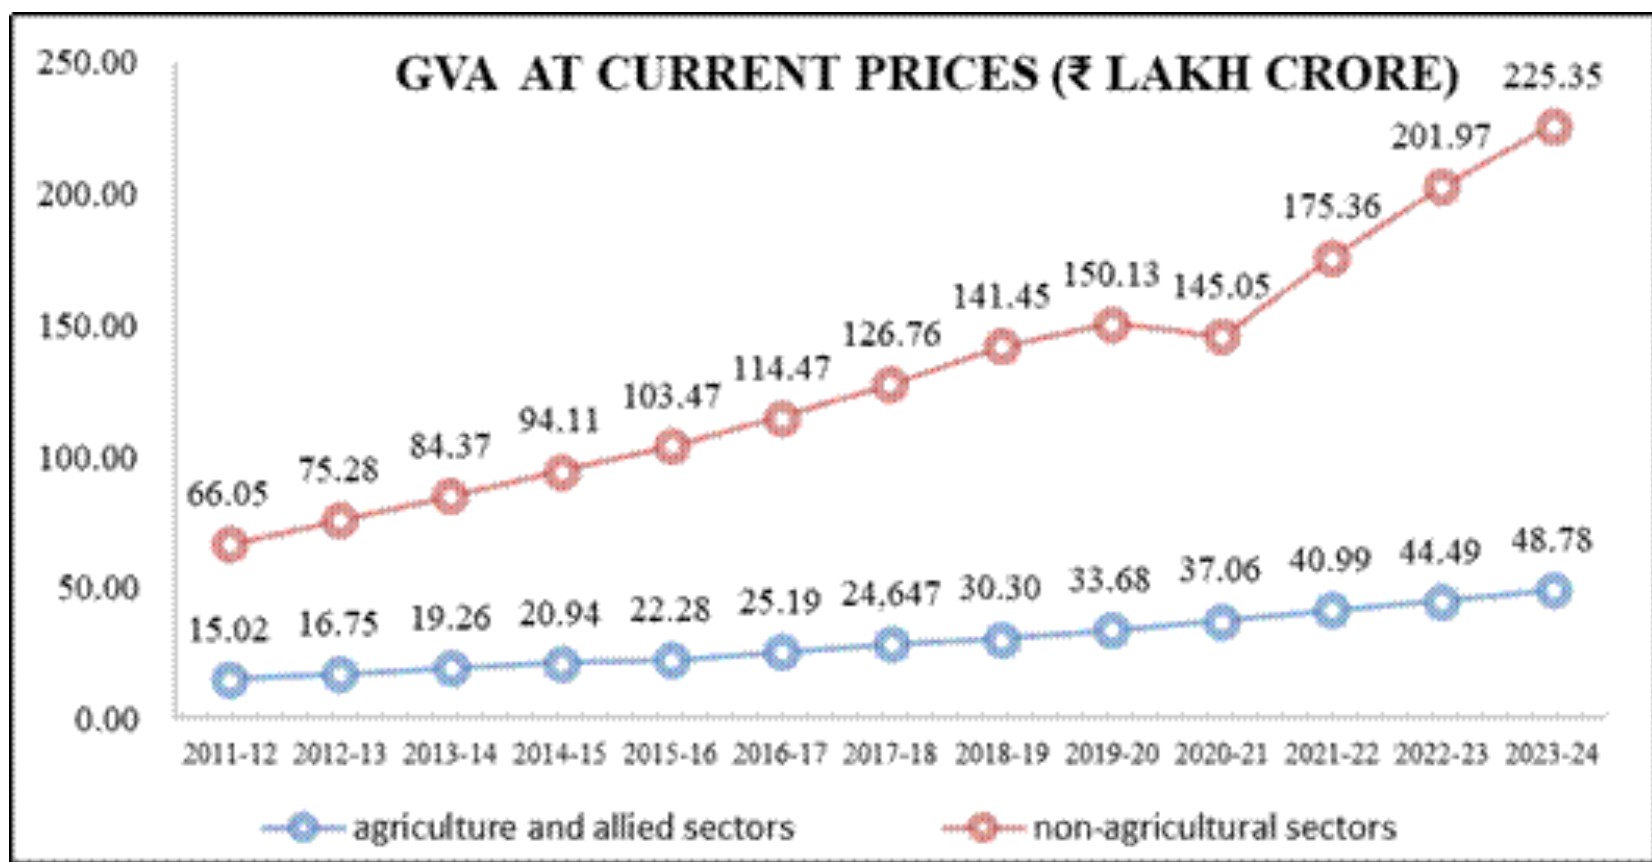
- 02 Jul 2025
In News:
The National Statistics Office (NSO), under the Ministry of Statistics and Programme Implementation, released its annual publication, Statistical Report on Value of Output from Agriculture and Allied Sectors (2011–12 to 2023–24). This comprehensive report provides granular data on output values across crop, livestock, forestry, and fisheries sectors at both current and constant (2011–12) prices, offering crucial insights into trends, sectoral contributions, and regional dynamics in Indian agriculture.
Growth Trajectory and Sectoral Contributions
The Gross Value Added (GVA) of agriculture and allied sectors at current prices rose by 225%, from ?1,502 thousand crore in 2011–12 to ?4,878 thousand crore in 2023–24. At constant prices, the Gross Value of Output (GVO) increased by 54.6%, from ?1,908 thousand crore to ?2,949 thousand crore during the same period.
The crop sector remained the backbone of the agricultural economy, contributing ?1,595 thousand crore or 54.1% of the total GVO in 2023–24. Within this, cereals and fruits & vegetables together formed 52.5% of the crop output. Notably, paddy and wheat alone accounted for 85% of cereal GVO. Five states—Uttar Pradesh, Madhya Pradesh, Punjab, Telangana, and Haryana—contributed 53% of the total cereal output, with Uttar Pradesh maintaining its top position despite a decline in share from 18.6% to 17.2%.
Shifting Dynamics in Horticulture
The horticulture sector has witnessed dynamic changes. In fruits, banana (?47,000 crore) surpassed mango (?46,100 crore) in 2023–24, breaking mango’s longstanding dominance. In the vegetable group, potato retained its lead, with GVO rising from ?21,300 crore to ?37,200 crore between 2011–12 and 2023–24.
Floriculture emerged as a growing commercial interest, with its GVO nearly doubling from ?17,400 crore to ?28,100 crore. The shifts in leading states in the production of fruits, vegetables, and floriculture underscore regional diversification in agricultural growth.
Rise of Livestock and Allied Sectors
The livestock sector experienced substantial growth, with its GVO nearly doubling from ?488 thousand crore to ?919 thousand crore. While milk remained the dominant product, its share slightly decreased from 67.2% to 65.9%, whereas meat products increased their share from 19.7% to 24.1%.
In the condiments and spices category, Madhya Pradesh emerged as the top contributor with a 19.2% share, followed by Karnataka (16.6%) and Gujarat (15.5%).
The forestry and logging sector saw a moderate increase in GVO from ?149 thousand crore to ?227 thousand crore. Significantly, the share of industrial wood surged from 49.9% to 70.2%, indicating growing commercialization.
Emerging Importance of Fisheries
The fishing and aquaculture sector is becoming increasingly vital, with its contribution to total agricultural GVO rising from 4.2% to 7.0% over the period. While inland fish share declined from 57.7% to 50.2%, marine fish increased from 42.3% to 49.8%. States like West Bengal and Andhra Pradesh witnessed substantial structural shifts in fisheries production patterns.
Why Governments Revise GDP Base Year and Why India’s 2026 Revision Matters
- 20 Jun 2025
Context:
The Gross Domestic Product (GDP) is the most critical metric used to measure the size and performance of a country’s economy. The "base year" is the reference year against which future GDP growth is calculated. India’s current GDP base year is 2011–12. The government, through the Ministry of Statistics and Programme Implementation (MoSPI), is now preparing to revise it to 2022–23, with the updated series to be released in February 2026.
Why GDP Base Years are Revised
Base year revisions are necessary to reflect structural changes in the economy, incorporate improved and updated data sources, and align with global statistical standards. GDP calculation, by its definition—the market value of all final goods and services produced in an economy—requires accurate, timely, and sectorally-relevant data. However, India’s economy evolves rapidly, particularly with the expansion of the services sector and changes in consumption, production, and labour patterns.
Past revisions (seven since 1948-49) reflect efforts to modernize methodology and include newer data sources, such as the shift from decennial Census-based workforce estimates to five-yearly Employment-Unemployment Surveys by the NSSO. This aligns with the National Statistical Commission’s recommendation of rebasing economic indices every five years.
The last revision occurred in 2015 (base year changed to 2011–12), following which methodological changes attracted controversy. Experts, including former Chief Economic Advisor Arvind Subramanian, argued that the revised methodology overestimated India’s GDP growth, especially in manufacturing, due to reliance on corporate database MCA-21 over the traditional Annual Survey of Industries.
Why the 2026 Revision Is Crucial
The 2026 revision comes after India missed a base year update in 2017–18 due to data-related concerns. Two key surveys—the Consumer Expenditure Survey (CES) and the Periodic Labour Force Survey (PLFS)—faced credibility and methodological challenges. The 2017-18 CES suggested rising poverty, while the PLFS showed a 45-year high in unemployment—trends contrary to government narratives. These issues led to scrapping the proposed 2017–18 base year.
Additionally, disruptive policy changes like demonetisation (2016) and the rollout of GST (2017), followed by the COVID-19 pandemic, meant the following years were not "normal" reference points. The 2022–23 base year is likely to mark the first post-pandemic stable year suitable for a revised series.
This revision is especially significant as India is poised to become the world’s third-largest economy by nominal GDP. At such a juncture, the quality, accuracy, and global credibility of GDP data will directly influence investor confidence, credit ratings, and policymaking.
The base year revision will also extend to other indicators: the Index of Industrial Production (IIP) will be revised to 2022–23, and the Consumer Price Index (CPI) to 2023–24. These changes ensure that inflation and industrial output metrics remain reflective of present-day consumption and production structures.
Conclusion
Revising the GDP base year is not merely a technical exercise—it is central to economic governance. The upcoming 2026 revision must restore faith in India's statistical systems, offer a transparent methodology, and align with international best practices. Its credibility will shape India’s economic narrative for the decade to come, both domestically and on the global stage.
Scaling India's Apparel Sector for Export Growth
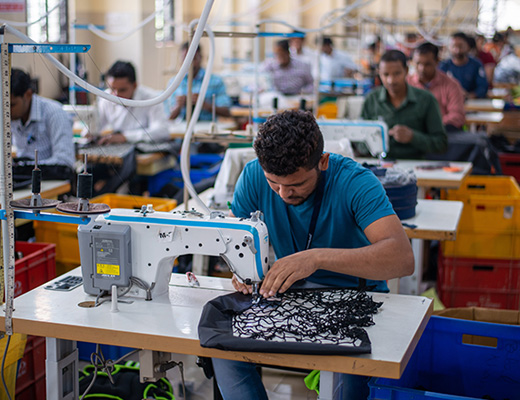
- 10 Jun 2025
In News:
India’s textiles and apparel (T&A) sector is one of its oldest and most employment-intensive industries, contributing 2.3% to GDP and employing over 45 million people, making it the second-largest employer after agriculture. Despite this, India’s share in global apparel trade has remained stagnant at around 3% for two decades—far below its potential. With global apparel trade at $529.3 billion, India’s contribution stands at just $15.7 billion, and the ambitious target of $40 billion in exports by 2030 remains distant unless bold structural reforms are initiated.
Structural Challenges
The fragmentation of the industry is a major bottleneck. Over 80% of apparel units are MSMEs, operating with limited scale, informal labour, and poor integration. In contrast, countries like China, Vietnam, and Bangladesh have achieved scale by setting up large, export-oriented factories or coordinated "buying houses" to pool capacity.
India’s cost of capital (≈9%) also hampers competitiveness, compared to 3–4.5% in China and Vietnam. Further, rigid labour laws, such as mandatory 2x overtime pay, discourage formal employment. Supply chains are dispersed, increasing delivery timelines and logistics costs. These issues are compounded by low female labour force participation, despite women comprising 70% of the workforce in leading apparel hubs.
Success Story: Shahi Exports
The example of Shahi Exports illustrates what is achievable with scale, professionalism, and inclusive practices. From a 15-member unit in 1974, it has evolved into India’s largest apparel exporter, employing over 100,000 workers (70% women) across 50+ factories in 8 states, with over $1 billion in revenue. It shows that Indian firms can scale and compete globally, but organic growth alone is too slow to meet national export goals.
Policy Reforms: A Way Forward
To unlock the sector’s full potential, transformative policy measures are required:
- Capital Access for Scale: A 25–30% capital subsidy and a 5–7 year tax holiday for units with 1,000+ machines would help achieve viable scale. Linking incentives to size, as proposed under PLI 2.0, is essential.
- Flexible Labour Norms: Labour reforms, such as rationalising overtime pay to 1.25x (ILO standard), and easing compliance can encourage formal hiring. Linking MGNREGA funds (25–30%) to wage subsidies in garment units can promote productive, formal employment.
- Skilling for Demand: Schemes like SAMARTH should be expanded for short-cycle, demand-driven training, especially for women and youth, to bridge the skills gap in the sector.
- Cluster-Based Development: At least two PM MITRA Parks should be designated as garment hubs in labour-abundant, low-cost states like Uttar Pradesh and Madhya Pradesh to reduce migration, cut costs, and promote inclusive industrialisation.
- Export-Linked Incentives (ELI): Shift from production-linked to export-linked schemes that reward global competitiveness, not just output.
Conclusion
The apparel sector offers a rare opportunity to generate mass employment, promote inclusive growth, and boost exports. But without scale, reforms, and a strategic policy shift, the $40 billion export dream will remain elusive. India must act swiftly to replicate success stories like Shahi Exports, not over decades, but within years. The time for bold policy innovation is now.
India’s Decline in Extreme Poverty: A Decade of Significant Gains
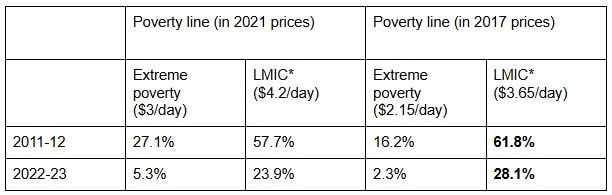
- 08 Jun 2025
In News:
According to the latest World Bank estimates, India’s extreme poverty has sharply declined from 27.1% in 2011-12 to 5.3% in 2022-23, based on an updated $3/day consumption threshold adjusted for 2021 purchasing power parity (PPP). In absolute terms, the number of extremely poor people has reduced from 344.47 million to 75.24 million, indicating 269 million people were lifted out of extreme poverty during this period.
The progress is more striking when viewed under the previous poverty line of $2.15/day (2017 prices). Under this standard, the extreme poverty rate fell from 16.2% to 2.3%, translating to a drop in the number of poor from 205.93 million to 33.66 million—a reduction of 172 million individuals.
Even as the poverty threshold was raised globally, India managed to outperform most developing countries. The lower-middle-income (LMIC) poverty rate, measured at a higher threshold of $4.20/day, also fell substantially—from 57.7% in 2011-12 to 23.9% in 2022-23. This decline reduced the number of people under LMIC poverty from 732.48 million to 342.32 million over 11 years.
The fall in poverty occurred despite high inflation during the decade. When adjusted for domestic inflation, even the $3/day threshold (new benchmark) is higher than the inflation-adjusted $2.60/day from previous estimates, making the achievement more credible.
The World Bank estimates also reveal stark differences in poverty distribution:
- The top five populous states—Uttar Pradesh, Maharashtra, Bihar, West Bengal, and Madhya Pradesh—accounted for 65% of extreme poverty in 2011-12, but still made up 54% in 2022-23.
- Rural India still shows significant poverty, with 90% of rural individuals reporting average monthly per capita expenditures below Rs 5,763, and the bottom 5% class spending just Rs 1,677.
- Urban poverty is relatively lower, with 25.78% in the bottom 40%, compared to 45.44% in rural areas.
- Educational attainment remains a strong poverty determinant; in 2022-23, 35.1% of Indians without schooling lived below the LMIC poverty line, compared to 14.9% with post-secondary education.
In terms of non-monetary deprivation, India also recorded improvement. As per the Multidimensional Poverty Index (MPI), which considers factors such as access to education, electricity, water, and sanitation, multidimensional poverty fell from 53.8% in 2005-06 to 15.5% in 2022-23. NITI Aayog estimates it to be 11.28%, down from 29.17% in 2013-14.
To ensure continued tracking, NITI Aayog is planning a new income-based extreme poverty measure with broader consultation. Meanwhile, the Household Consumption Expenditure Survey (HCES) 2023-24 indicates a 45.4% rise in rural consumption and 38% in urban consumption, reinforcing the World Bank’s findings.
Conclusion
India’s remarkable poverty reduction over the last decade reflects successful economic reforms, social welfare schemes, and increased consumption. However, regional, educational, and rural-urban disparities persist, necessitating continued policy focus, data refinement, and inclusive growth strategies.
Revisiting NREGA Wage Rates: A Case for Urgent Reform
- 12 Apr 2025
In News:
The Mahatma Gandhi National Rural Employment Guarantee Act (MGNREGA) is the world’s largest public employment programme, aimed at ensuring livelihood security through guaranteed rural employment. However, a recent report by the Parliamentary Standing Committee on Rural Development and Panchayati Raj (April 2025) underscores a critical challenge: the wage rates under MGNREGA are increasingly inadequate, failing to provide even subsistence-level income.
With over 25 crore registered workers, the scheme is central to rural welfare. Yet, its effectiveness is diluted due to systemic underpayment. For FY 2025–26, MGNREGA wages vary from ?241 in Nagaland to ?400 in Haryana, averaging only ?294 nationally—a meagre 5% increase from the previous year. In many states, this rate is significantly lower than the prevailing minimum wage, in some cases by over ?200, raising serious questions about wage fairness and constitutional obligations.
Legal and Policy Background
Section 6 of the MGNREGA Act permits the Centre to fix wage rates independently of the Minimum Wages Act, 1948, though the wage cannot be below ?60. Historically, from 2005 to 2009, NREGA wages matched each state’s minimum agricultural wage. However, the Centre capped NREGA wages at ?100 in 2009 due to financial concerns, leading to payments falling below statutory minimum wages—a move that the Karnataka High Court (2011) and Supreme Court (2012) found violative of labour rights.
In response to mounting concerns, wage indexation to the Consumer Price Index for Agricultural Labourers (CPI-AL) began in FY 2011–12, with 2009 as the base year. Nevertheless, CPI-AL is narrow in scope compared to CPI-Rural (CPI-R), which better reflects the cost of living for rural workers across sectors.
Ignored Recommendations and Institutional Apathy
Several expert bodies have urged wage revisions. The Jean Dreze Committee (2010) advocated aligning NREGA wages with state minimum wages or, at the very least, indexing them effectively. The Mahendra Dev Committee (2014) recommended CPI-R-based indexing with an updated base year, while the Anoop Satpathy Committee (2019) proposed a national floor wage of ?375 (at July 2018 prices). However, the Centre has largely disregarded these suggestions, citing fiscal constraints.
Only a few states, including Odisha and Himachal Pradesh, have supplemented NREGA wages from their own budgets. Most continue with the Centre’s insufficient rates, causing regional disparities and undermining the constitutional promise of equal pay for equal work (Article 39).
Need for Course Correction
The current wage structure risks violating Article 23 of the Constitution, as flagged in the Supreme Court’s 1983 Sanjit Roy vs State of Rajasthan verdict, which held that paying less than the minimum wage constitutes “forced labour.”
Moreover, stagnant wages have contributed to declining worker participation. The Standing Committee rightly argues that current wages do not meet basic daily expenses and recommends a minimum daily wage of ?400. Without wage parity and realistic indexation, the scheme fails to uphold its foundational promise of dignified rural employment.
Conclusion
MGNREGA is more than a welfare scheme—it is a statutory right. To realize its full potential in promoting rural livelihoods and inclusive growth, wage reforms are imperative. Revising NREGA wages to reflect minimum wage laws, inflation trends, and regional parity is not just an economic necessity—it is a constitutional obligation.
India’s Green Economy: A Catalyst for Employment and Sustainable Development

- 04 Jun 2025
In News:
India’s transition to a green economy is not only central to achieving its environmental and climate goals but is also emerging as a powerful engine for economic growth and employment generation.
According to a recent report by NLB Services, India’s green sector is expected to generate approximately 7.29 million new jobs by FY2027–28, with the figure projected to rise to 35 million by 2047, aligning with India’s long-term net-zero commitments.
Understanding the Green Economy
A green economy encompasses sectors and activities that contribute to ecological sustainability, low-carbon development, and resource efficiency, while also promoting inclusive employment. It integrates environmental goals with economic planning, thus creating green jobs in areas such as renewable energy, electric mobility, sustainable construction, waste management, and green agriculture.
Sectoral and Regional Dynamics
The most significant employment potential lies in industries such as renewable energy, electric vehicles (EVs), green infrastructure, sustainable textiles, and waste-to-energy solutions. These sectors have witnessed rising investments and policy focus under national missions such as PM-KUSUM, Faster Adoption and Manufacturing of Hybrid and Electric Vehicles (FAME), and the National Hydrogen Mission.
While metropolitan areas like Mumbai, Bengaluru, and Delhi remain hubs for green employment, tier II and III cities are poised to play a crucial role in the decentralisation of the green economy. Cities such as Jaipur, Coimbatore, Bhubaneswar, Visakhapatnam, and Indore are projected to account for 35–40% of the green job creation by FY28, primarily in logistics, warehousing, sustainable agriculture, and urban waste management.
Evolving Skill Demands
The transition towards green employment is redefining workforce skill requirements. Modern green jobs demand a blend of environmental sustainability expertise and technological proficiency, particularly in AI, IoT, GIS, blockchain, and data analytics. This digital integration is reshaping job profiles and creating pathways for future-ready employment.
In response, industries are shifting hiring strategies to focus more on skill-based recruitment rather than conventional degrees. There is also a growing emphasis on industry-academia collaborations to align curricula with the evolving demands of the green economy, thus fostering climate-literate and digitally equipped professionals.
Gender Inclusion and Equity Challenges
Despite the promising employment potential, women currently constitute only 11–12% of the green workforce in India. Barriers include limited access to STEM education, workplace safety concerns, and socio-cultural constraints. However, progressive employers are increasingly adopting inclusive hiring practices, promoting women-centric skill development programmes, and partnering with training agencies to build a more diverse and equitable green talent pipeline. These efforts are expected to improve female participation by 12–15% in the next 5–6 years.
Economic Significance
India’s green economy is expected to contribute significantly to national GDP. Its valuation is projected to reach $1 trillion by 2030, and expand to $15 trillion by 2070, supporting India’s target of achieving net-zero emissions by 2070. Thus, it offers a dual dividend—economic prosperity and environmental security.
Conclusion:
India’s green transition presents a transformative opportunity to simultaneously address climate change, unemployment, and regional disparities. With appropriate policy support, capacity building, and inclusivity, the green economy can become the bedrock of sustainable and equitable growth.
NITI Aayog Recommends Dedicated Credit Support and Reforms to Boost Medium Enterprises

- 28 May 2025
In News:
Medium enterprises (MEs), a vital yet under-recognized segment of India’s MSME ecosystem, have long faced significant challenges, especially in accessing affordable and timely credit. Though they constitute only about 0.3% of registered MSMEs, medium enterprises contribute nearly 40% of MSME exports, highlighting their critical role in India’s industrial growth and global trade competitiveness.
Significance of Medium Enterprises in the Indian Economy
The MSME sector as a whole contributes around 29% to India’s GDP and employs over 60% of the workforce. However, while micro and small enterprises dominate in number (97% and 2.7% respectively), medium enterprises represent a minuscule share by count but a disproportionately large share in exports and innovation. Medium enterprises have a turnover range of ?100–500 crore and investment in plant and machinery between ?25–125 crore, as per the revised FY26 classification norms announced in the Union Budget 2025-26.
Credit Gap and Financing Challenges
NITI Aayog’s 2025 report, Designing Policy for Medium Enterprises, reveals a credit deficit of approximately $10 billion faced by medium enterprises. This gap stems from institutional biases and structural constraints. Unlike micro units that benefit extensively from priority sector lending, medium enterprises receive fewer such loans and face borrowing costs about 4% higher than those for large companies. Moreover, out of 18 government MSME schemes, only 8 specifically target medium enterprises, which receive less than 18% of total scheme funds (?5,442 crore overall). The absence of dedicated working capital schemes exacerbates liquidity issues, limiting growth and scale-up prospects.
NITI Aayog’s Key Policy Recommendations
- Working Capital Financing Scheme: A sector-specific loan scheme, administered by the Ministry of MSME, is proposed to provide medium enterprises with working capital loans capped at ?25 crore, with individual requests up to ?5 crore. Loans would be linked to enterprise turnover and offered at concessional interest rates, addressing their substantial capital needs.
- Medium Enterprise Credit Card: To meet immediate liquidity requirements—such as payroll, inventory, and equipment maintenance—a credit card facility with a pre-approved limit of ?5 crore is recommended. This facility would follow market interest rates but include a repayment grace period.
- Expedited Credit Disbursal via Retail Banks: Leveraging local retail banks for faster fund distribution under MSME ministry supervision aims to reduce bureaucratic delays and enhance timely access to credit.
- Technology and Skilling Initiatives: The report advocates transforming existing MSME technology centres into ‘India MSME 4.0 Competence Centres’ tailored to sectoral and regional demands, spanning industries like engineering, electronics, and specialized manufacturing. It also proposes incorporating medium enterprise-specific modules into entrepreneurship training and skilling programmes to bridge labour skill mismatches.
- Digital Access and Compliance Support: NITI Aayog recommends creating a dedicated sub-portal within the Udyam platform that facilitates scheme discovery, compliance guidance, and AI-powered navigation to help medium enterprises efficiently access government resources.
Broader Structural Challenges
Apart from financing, medium enterprises face low adoption of advanced technologies, limited R&D support, inadequate sector-specific testing infrastructure, and a disconnect between training programmes and industry needs. These gaps impede innovation and scalability.
Strategic Importance and Policy Outlook
NITI Aayog emphasizes that medium enterprises have the potential to be major employment generators and innovation drivers if provided focused policy attention and financial support. Drawing lessons from global examples like Germany’s Mittelstand and Italy’s fashion industry, the report envisions India’s medium enterprises evolving into globally competitive firms over the next decade.
The medium sector’s formal labour structure also makes it key to transitioning India’s economy from informal to formal. Therefore, a coordinated and inclusive policy framework focusing on finance, technology, skill development, and digital infrastructure is vital to unlock this segment’s full potential and enhance India’s industrial competitiveness, export growth, and self-reliance.
India Becomes the 4th Largest Economy
- 26 May 2025
In News:
In a significant milestone for the Indian economy, India has officially surpassed Japan to become the 4th largest economy in the world in nominal GDP terms, as per the IMF World Economic Outlook (April 2025). According to NITI Aayog CEO B.V.R. Subrahmanyam, India’s GDP now stands at $4.19 trillion, marginally higher than Japan’s $4.18 trillion. This marks a historic moment, reflecting a shift in the global economic order and reaffirming India's rising stature on the world stage.
From Fifth to Fourth: A Decade of Accelerated Growth
India’s economic rise has been particularly notable over the past decade. From a GDP of $2 trillion in 2014, India has more than doubled its output to cross the $4 trillion mark in 2025. This rapid expansion has also been accompanied by a sharp rise in per capita income, which has grown from $1,438 in 2014 to $2,880 in 2025. In global rankings, India moved from the 5th position in 2024 to 4th in 2025, overtaking Japan and trailing only the United States, China, and Germany.
Factors Driving the Surge
India’s ascent is the result of multiple structural reforms and policy initiatives undertaken in recent years. Programs such as Digital India, Atmanirbhar Bharat, and the Production Linked Incentive (PLI) scheme have enhanced domestic manufacturing, boosted digital infrastructure, and encouraged self-reliance. The government’s focus on ease of doing business, tax reforms (GST, corporate tax rationalisation), and large-scale infrastructure investment under schemes like Gati Shakti have further catalysed growth.
Despite global trends towards supply chain diversification and reshoring, India continues to attract foreign companies due to its cost-effective labor, large consumer base, and improving logistics. For instance, companies like Apple continue to expand their operations in India, viewing it as a reliable manufacturing hub.
Strategic and Geopolitical Implications
India’s new economic position carries significant geopolitical weight. As the 4th largest economy, India’s influence in global financial institutions, climate negotiations, trade partnerships, and multilateral forums such as G20 and BRICS is set to grow. The achievement enhances investor confidence, thereby potentially increasing foreign direct investment (FDI) inflows.
Domestically, this growth presents an opportunity for addressing structural issues such as unemployment, regional disparities, and income inequality. The challenge ahead lies in ensuring that growth remains inclusive, sustainable, and innovation-driven.
Future Outlook
According to NITI Aayog, India is poised to surpass Germany within the next 2.5–3 years, potentially becoming the third-largest economy globally. For this, sustaining macroeconomic stability, boosting exports, enhancing skill development, and transitioning to a green economy will be crucial.
Conclusion
India’s rise to the 4th largest economy marks a defining moment in its development trajectory. It reflects not just statistical growth, but also the success of structural reforms, demographic potential, and policy resilience. As India prepares for its next leap, balancing economic dynamism with social equity will be the key to truly becoming a global economic leader.
Structural Shift in India’s Remittance Landscape

- 07 Apr 2025
In News:
According to the RBI’s latest Remittances Survey (2023–24), there has been a significant structural transformation in India's inward remittance patterns. Advanced Economies (AEs) — led by the United States, the United Kingdom, Canada, Singapore, and Australia — have overtaken the Gulf Cooperation Council (GCC) nations as the primary sources of remittances. This shift holds major implications for India’s migration, financial inflows, and socio-economic planning.
Changing Source Geography of Remittances
India’s total remittance inflow touched USD 118.7 billion in 2023–24, doubling since 2011. The United States alone accounted for 27.7%, followed by the UAE (19.2%), the UK (10.8%), Saudi Arabia (6.7%), and Singapore (6.6%). This marks a departure from the earlier dominance of the Gulf region, whose collective share has dropped to 38%, while Advanced Economies now contribute over 50%.
The top recipient states of these remittances in India are Maharashtra (20.5%), Kerala, and Tamil Nadu.
Factors Behind the Shift
1. Evolving Migration Trends:There has been a surge in professional, high-skilled Indian migrants heading to AEs, particularly in sectors like STEM, finance, and healthcare. These migrants tend to earn higher wages, have stronger job security, and remit more per capita compared to their low-skilled counterparts in the Gulf.
2. Declining Opportunities in the GCC:Several Gulf countries have implemented nationalisation policies like Saudi Arabia’s “Nitaqat,” which prioritise local hiring. Moreover, automation and economic diversification have reduced demand for foreign low-skilled workers. This, combined with COVID-19-induced job losses and return migration, has contributed to the decline in remittances from the region.
3. Education-Driven Migration:Countries like the UK, Australia, and Canada have emerged as popular education destinations. For instance, Indian migration to the UK tripled from 76,000 in 2020 to 250,000 in 2023. Post-study work opportunities and migration partnerships like the India-UK “Migration and Mobility Partnership” (2021) have bolstered this trend.
4. Cost and Mode of Transfers:Digitalisation has reduced remittance costs to India below the global average, although it still exceeds the SDG target of 3% for a US$200 transfer. Nonetheless, cash-based transactions remain significant for smaller amounts.
Economic and Policy Implications
1. Macroeconomic Importance:Remittances contribute about 3–3.5% of India’s GDP, consistently surpassing FDI and Official Development Assistance (ODA). They help finance nearly half of the merchandise trade deficit and act as buffers against external economic shocks.
2. Household-Level Impact:Remittances are pivotal for improving living standards, enabling expenditure on food, healthcare, and education. In Kerala, for instance, remittances account for over 36% of the state's domestic product.
3. Policy Challenges and Recommendations:
- Skill Alignment: Training systems must align with global job markets to prevent ‘wilful deskilling’ — where highly educated migrants take up low-skilled jobs.
- Migration Diplomacy: India must proactively negotiate bilateral/multilateral mobility agreements to secure rights, fair wages, and career progression for migrants.
- Diaspora Engagement: Policies should encourage productive use of remittances (e.g., investments, health, education) and tap diaspora networks for technology and knowledge transfer.
Conclusion
India’s remittance ecosystem is transitioning from Gulf-led low-skilled flows to knowledge-intensive, high-value contributions from Advanced Economies. Sustaining this trend will require strategic migration governance, skill reforms, and deepened engagement with the global Indian diaspora.
India’s Employment Challenge: Bridging the Gap Between Labour& Capital in the Era of Technological Transformation
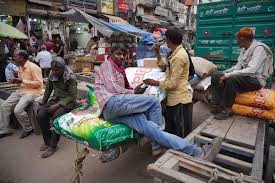
- 06 Apr 2025
Context:
India is experiencing a paradoxical trend — despite a rapidly expanding working-age population and rising production capacity, the generation of formal employment opportunities remains insufficient. Since 2017–18, while the working-age population has increased by approximately 9 crore, formal sector jobs have grown by only 6 crore, indicating an annual shortfall of around 50 lakh jobs. This mismatch is further compounded by the dominance of self-employment and informal sector jobs, especially in rural areas, raising concerns about both the quality and sustainability of employment.
Structural Shift Towards Capital-Intensive Growth
The country’s production systems are increasingly exhibiting capital-intensive tendencies — even in traditionally labour-intensive sectors such as textiles and food processing. This phenomenon, often referred to as "skill-biased technological change," is driven by two broad factors:
- Demand-Side Factors: The pressure to enhance productivity and reduce costs incentivises adoption of automated and capital-intensive technologies, especially in high-value manufacturing and services.
- Supply-Side Constraints: A shortage of skilled and technically trained labour impedes the effective utilisation of labour resources. Less than 10% of India’s workforce has received formal vocational or technical training, and most youth entering the labour market lack industry-relevant skills.
The declining cost of technology, coupled with stagnant real wages and rigid labour laws in some states, further tilts the balance in favour of machines over human labour.
Policy Interventions and Challenges
The Government of India has initiated schemes such as the Production-Linked Incentive (PLI) Scheme and the Employment Linked Incentive (ELI) Scheme to address the employment deficit.
- PLI Scheme: While it aims to boost manufacturing output, the scheme is heavily focused on high-tech sectors like electronics, drones, and IT hardware — which are capital- and skill-intensive. Despite this, the highest job creation under the PLI has been observed in food processing and pharmaceuticals, suggesting a disconnect between investment focus and employment potential.
- ELI Scheme: Designed to subsidise the cost of hiring untrained workers in labour-intensive sectors, the ELI provides short-term financial support via EPFO contributions. However, its long-term efficacy in ensuring sustainable skilling and employment remains uncertain due to lack of outcome data and short subsidy duration (2–3 years).
Need for a Cohesive Labour-Capital Policy Framework
India’s employment challenge cannot be addressed through fragmented policies. A cohesive framework is required that integrates:
- Industrial Policy with Skilling Policy: Ministries responsible for industrial production, labour, and skilling must work in tandem to ensure the availability of a workforce with skills that are aligned with the demands of emerging sectors.
- Incentive Structuring: The current flat subsidies under ELI could be modified into a graded structure, where higher transfers are provided for higher levels of certified skill acquisition, encouraging continuous skill upgrading.
- Skill Supply Chain Reform: Skill development institutions like ITIs and vocational centres should be incentivised based on placement rates and wage outcomes, not just enrolments or certifications.
- Labour Law Flexibility: State-level reforms in labour regulations are essential to reduce the cost of employing formal workers and to encourage job creation, especially in micro, small, and medium enterprises (MSMEs).
Way Forward for a Viksit Bharat (Developed India)
As India transitions towards becoming a high-value production economy, it must simultaneously invest in its human capital. This requires:
- Dynamic Skill Development Programs: Adaptive skilling strategies must be designed to align with evolving technological trends such as Artificial Intelligence (AI), robotics, and green energy.
- Data-Driven Employment Policies: Regular labour market surveys and outcome tracking of employment schemes are critical for evidence-based policymaking.
- Support for Labour-Intensive Sectors: Focused support to industries with high employment elasticity, such as textiles, leather, food processing, tourism, and construction, can yield substantial job creation.
In conclusion, advancing the agenda of Viksit Bharat demands equal emphasis on capital and labour. Without a strong and skilled workforce, India's demographic dividend risks turning into a demographic burden. Therefore, employment generation must be at the core of India’s development policy, with a strategic vision that links skilling, production, and structural transformation.
India’s Decade of Progress in Poverty Reduction
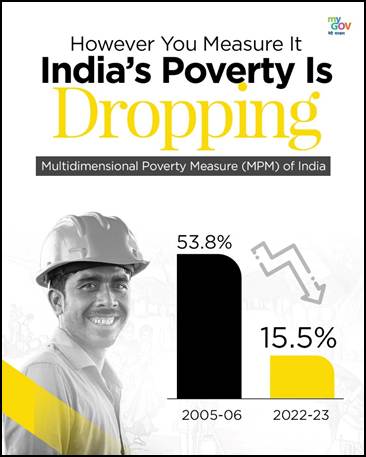
- 01 May 2025
In News:
The World Bank’s Spring 2025 Poverty and Equity Brief has lauded India for lifting 171 million people out of extreme poverty between 2011-12 and 2022-23, reducing the poverty rate from 16.2% to 2.3%. This achievement underscores India’s sustained commitment to inclusive development, driven by economic growth, targeted welfare interventions, and improved access to essential services.
Key Findings:
The Poverty and Equity Briefs (PEBs), published biannually by the World Bank, assess poverty trends using international benchmarks (USD 2.15/day for extreme poverty, USD 3.65/day for lower-middle-income poverty), and include multidimensional poverty indicators and Gini Index estimates for income inequality.
- Rural and Urban Progress:
- Rural extreme poverty declined from 18.4% to 2.8%.
- Urban extreme poverty fell from 10.7% to 1.1%.
- The rural-urban poverty gap narrowed significantly, indicating more balanced regional development.
- Lower-Middle-Income Poverty (USD 3.65/day line):
- National poverty fell from 61.8% to 28.1%, lifting 378 million people out of poverty.
- Rural poverty declined from 69% to 32.5%, and urban from 43.5% to 17.2%.
- State-wise Contribution:Uttar Pradesh, Maharashtra, Bihar, West Bengal, and Madhya Pradesh—accounting for 65% of India’s poor in 2011—contributed two-thirds of the total poverty reduction by 2022-23.
- Multidimensional Poverty:
- MPI fell from 53.8% (2005-06) to 16.4% (2019-21).
- By 2022-23, it further reduced to 15.5%, indicating improvements in health, education, and living standards.
- Income Inequality:India’s Gini Index improved from 28.8 to 25.5, signaling a modest reduction in income disparities.
Employment and Structural Shifts
Employment growth has been robust post-2021:
- Female employment has increased, though still only 31%, with a 234 million gender gap in paid work.
- Urban unemployment declined to 6.6% in Q1 FY24-25, the lowest since 2017-18.
- A shift from rural to urban employment was noted among men, while rural women increasingly engage in agricultural self-employment.
Persistent Social Challenges
Despite progress, several social challenges persist:
- Marginalized communities (SCs/STs) face limited access to quality education, healthcare, and formal jobs.
- Malnutrition and health disparities remain despite schemes like POSHAN Abhiyaan.
- Water and energy poverty still affect large segments—49.8% of rural households lack piped water (NFHS-5), and many still rely on biomass despite the Ujjwala Yojana.
- Mental poverty due to chronic stress, unemployment (29% among graduates), and social stigma hinders productivity.
- Environmental degradation from unsustainable resource use affects the poorest most, worsening poverty cycles.
Policy Recommendations
To build on this progress, India must:
- Strengthen affirmative action and welfare delivery (e.g., PMJDY, DDU-GKY, Aadhaar-based targeting).
- Promote gender equality through effective implementation of BetiBachaoBetiPadhao, SSY, and gender-inclusive job creation.
- Expand clean energy and water access via solar microgrids and the Jal Jeevan Mission.
- Scale up mental health services using ASHA workers and awareness campaigns.
Conclusion
India’s success in drastically reducing poverty—both monetary and multidimensional—demonstrates the impact of focused development policies. However, the path ahead requires deeper reforms targeting inequality, gender disparity, and service delivery inefficiencies to ensure sustained, inclusive growth.
India’s E-Retail Landscape

- 28 Mar 2025
Context:
India’s e-retail sector has emerged as a global frontrunner, surpassing the United States in terms of online shopper base and attaining a Gross Merchandise Value (GMV) of $60 billion in 2024. Despite this milestone, the sector’s growth rate halved from historical averages of 20% to 10–12% in 2024. This deceleration is attributed primarily to macroeconomic headwinds—particularly high inflation and stagnation in real wages, which have also slowed private consumption growth from 11% (2017–19) to 8% (2022–24).
Structural Drivers and Government Support
Notwithstanding short-term sluggishness, India’s long-term e-retail outlook remains promising. Key government initiatives—such as Digital India, Make in India, Startup India, and Skill India—have laid a strong digital foundation. The Government e-Marketplace (GeM) crossed ?4 lakh crore GMV in FY24, reflecting growing public sector adoption of digital commerce.
Policy reforms have facilitated e-commerce expansion:
- 100% FDI in B2B e-commerce
- Implementation of Consumer Protection (E-commerce) Rules, 2020
- Strengthening digital infrastructure through 5G rollout
- The CSC-ONDC partnership aims to democratize access to digital markets in rural areas.
Key Growth Trends Shaping the Sector
The Flipkart–Bain & Company report identifies three transformative trends:
- Quick Commerce:Quick commerce now commands over two-thirds of e-grocery orders and constitutes 10% of total e-retail spending. It is projected to grow at over 40% CAGR until 2030, driven by faster deliveries, increasing product categories, and geographic expansion into Tier-2 and Tier-3 cities.
- Trend-First Commerce:Particularly dominant in fashion, this segment caters to consumers who prioritize latest trends and styles. Trend-first fashion alone is forecasted to grow fourfold to $8–10 billion by 2028, with more than half of the sales occurring online.
- Hyper-Value Commerce:This model emphasizes ultra-low-priced assortments aimed at lower-middle-income consumers. Its share of e-retail GMV has increased from 5% in 2021 to over 12% in 2024, gaining momentum in smaller towns and cities.
Demographic and Regional Shifts
The e-retail customer and seller base is witnessing increasing diversification:
- Since 2020, 60% of new shoppers have emerged from Tier-3 or smaller cities.
- The Northeastern states show 1.2 times higher e-retail penetration compared to the national average.
- Similarly, 60% of new sellers since 2021 are from Tier-2 or smaller towns, indicating broad-based entrepreneurial participation.
Future Outlook
E-retail is expected to reach a GMV of $170–190 billion by 2030, growing at over 18% annually. A key inflection point will be when India’s GDP per capita crosses the $3,500–4,000 threshold, historically associated with significant upticks in discretionary digital spending. By 2030, one in ten retail dollars is projected to be spent online, with high-frequency categories such as grocery, lifestyle, and general merchandise accounting for two-thirds of e-retail expenditure.
Conclusion
India’s e-retail sector reflects the dynamic interplay of technology, policy, and socio-economic shifts. While macroeconomic challenges have tempered short-term growth, strong structural fundamentals and strategic disruptions position the sector for robust expansion. The transformation of digital commerce, particularly through inclusivity and value-driven models, is not only reshaping consumer behavior but also holds significant implications for employment, urbanization, and digital governance in India’s developmental journey.
India’s 5G Revolution

- 21 Mar 2025
Context:
India is undergoing a digital transformation powered by rapid expansion in mobile broadband. According to Nokia’s Mobile Broadband Index (MBiT) Report 2024, India’s average monthly data usage per user reached an all-time high of 27.5 GB. The exponential growth in 5G adoption, traffic, and device readiness reflects a critical shift in the country’s telecom and digital infrastructure landscape.
Key Trends in Data Consumption and 5G Expansion
The report highlights several key trends that underline India's accelerating digital momentum:
- Average Data Consumption: The average mobile user in India consumed 27.5 GB/month in 2024, underlining the growing demand for video streaming, social media, and real-time applications.
- Surge in 5G Traffic: 5G data traffic tripled over the past year, with projections indicating it will overtake 4G by Q1 2026. The shift is especially noticeable in urban areas.
- Metro-Centric 5G Usage: In India’s metro circles, 5G now accounts for 43% of total mobile broadband usage, up from 20% in 2023, suggesting early saturation and readiness in Tier 1 cities.
- Rural Uptake Rising: While metros lead the way, Category B and C circles are witnessing strong growth in 5G uptake, aided by affordable smartphones and increased network coverage.
- Device Readiness: There were 271 million active 5G devices in India in 2024, doubling year-on-year. By 2025, 90% of replaced smartphones are expected to be 5G-enabled, indicating widespread device transition.
- Fixed Wireless Access (FWA): Users with 5G FWA consume 12 times more data than typical mobile users, showing the potential of 5G in delivering high-speed home internet in underserved areas.
Implications for India’s Digital Future
- Economic Growth and Innovation: The 5G revolution is expected to unlock new avenues in fintech, ed-tech, health-tech, and smart manufacturing. Higher data speeds and lower latency will enhance productivity and efficiency across sectors.
- Bridging the Digital Divide: Increasing rural adoption of 5G, aided by government and private investments, can significantly reduce the urban-rural connectivity gap and foster inclusive development.
- Employment and Start-up Ecosystem: The emergence of a robust 5G ecosystem will create demand for new skills, boosting employment in AI, IoT, cloud computing, and edge technologies.
- Network Transformation: The transition from 4G to 5G marks a fundamental change in telecom infrastructure, requiring upgradation in backhaul capacity, spectrum efficiency, and fibre penetration.
Challenges and the Road Ahead
Despite rapid adoption, challenges remain. Ensuring affordable access in rural areas, addressing cybersecurity risks, and enhancing digital literacy are vital. Policy coherence, right-of-way (RoW) reforms, and spectrum management will determine the pace and inclusivity of 5G deployment.
Conclusion
India’s 5G journey marks a pivotal step toward becoming a digitally empowered society. With supportive policy frameworks, private sector innovation, and public investment in digital infrastructure, the country is well-positioned to leverage 5G as a tool for economic transformation, digital inclusion, and technological leadership.
NBFC Stress and Systemic Risks in India’s Financial System

- 14 Mar 2025
In News:
The International Monetary Fund (IMF), in its report titled India Financial System Stability Assessment, has flagged significant vulnerabilities in India’s financial architecture, particularly arising from the Non-Banking Financial Companies (NBFCs) sector. Despite overall resilience post-pandemic, the increasing interconnectedness and exposure of NBFCs pose emerging systemic risks.
A major concern highlighted is the concentration of NBFC lending to the power sector. In FY 2024, 63% of power sector loans were provided by just three large Infrastructure Financing NBFCs—an increase from 55% in FY 2020. This overexposure, particularly by state-owned NBFCs such as IREDA, raises red flags given the inherent risks in infrastructure financing, including delays, cost overruns, and revenue shortfalls. The report notes that 56% of NBFC lending was financed by market instruments like corporate bonds and mutual funds, heightening the risk of contagion in case of financial distress.
NBFCs differ structurally from banks. They cannot accept demand deposits, lack deposit insurance coverage, and have no direct access to Reserve Bank of India (RBI) liquidity windows. Consequently, any shock in their repayment capacity can lead to asset-liability mismatches, potentially spilling over into banks, mutual funds, and bond markets, amplifying systemic risks.
The IMF also examined stress scenarios such as stagflation—a situation characterized by slow economic growth and high inflation. In such cases, public sector banks (PSBs) are particularly vulnerable. The Capital Adequacy Ratio (CAR) of PSBs could fall to the regulatory minimum of 9% under stress, threatening their ability to absorb losses. This is concerning, as the RBI mandates a minimum CAR of 12% for PSBs. The IMF recommends that PSBs retain earnings instead of paying dividends to strengthen their capital buffers and support credit flow during downturns.
While banks and NBFCs have shown broad resilience, ‘weak tails’ exist—non-systemic NBFCs and urban cooperative banks with below-minimum or even negative capital. This underscores the need for strengthened regulatory oversight, especially over state-owned NBFCs, which currently enjoy relaxed prudential norms. The IMF calls for uniform regulation across public and private NBFCs to ensure a level playing field and greater financial stability.
The report also emphasizes the need for improved data sharing and systemic risk monitoring, especially related to NBFC exposures, household credit, and climate-linked financial risks. Physical and transition risks remain moderate but are notable in monsoon-dependent agriculture and carbon-intensive industries like thermal power.
Recommendations include:
- Extending the cybersecurity risk framework to major NBFCs.
- Implementing IFRS-9 based credit risk assessments and countercyclical capital buffers.
- Improving insolvency and bankruptcy resolution mechanisms to reduce recovery time and enhance credit discipline.
India’s financial system is becoming more diverse and inclusive, with rising digital financial access and market participation. However, to sustain growth and resilience, proactive reforms in NBFC regulation, capital adequacy, and systemic risk management are essential.
India’s Textile Industry

- 08 Mar 2025
Context:
India’s textile and apparel industry is one of the largest globally, contributing significantly to the economy through employment, exports, and industrial output. It accounts for 2.3% of India’s GDP (projected to rise to 5% by 2030), 13% of industrial production, and 12% of total exports. Employing over 4.5 crore people, it is second only to agriculture in job creation. Yet, despite its scale, India lags behind competitors like China, Vietnam, and Bangladesh in global exports.
Current Status and Strengths
India is the world’s second-largest producer of cotton and man-made fibres (MMFs) such as polyester and viscose. Cotton alone engages over 60 lakh farmers, mainly in Gujarat, Maharashtra, and Telangana. The country is also a global leader in jute and technical textiles. The textile and apparel market is projected to reach USD 350 billion by 2030.
FY24 exports stood at USD 35.9 billion, a marginal increase from USD 33.4 billion in FY20. Key destinations include the US, EU, and UAE. Yet, apparel exports have declined from USD 15.5 billion in FY20 to USD 14.5 billion in FY24. While cotton textile exports rose to USD 12.3 billion, growth has remained modest.
Challenges Holding Back the Sector
- Fragmented Supply Chains: India’s textile value chain is highly fragmented, concentrated in MSME clusters with regional specializations (e.g., Tiruppur for knitwear, Surat for polyester). This hampers integration and increases logistics costs. In contrast, competitors operate vertically integrated “fibre-to-fashion” hubs.
- High Raw Material Costs: Quality Control Orders (QCOs) on polyester and viscose restrict cheaper imports. As a result, domestic fibres are significantly costlier—polyester by 33–36% and viscose by 14–16% compared to China.
- Lack of FTAs: Unlike Vietnam and Bangladesh, India lacks preferential trade agreements with major markets like the EU and the US. This undermines price competitiveness and limits market access.
- Regulatory Burden: Complex customs and compliance procedures increase operational costs, particularly for small exporters. In contrast, simplified systems in competing nations reduce red tape.
- Sustainability Pressures: Global markets now demand higher environmental compliance—renewable energy use, water recycling, and traceability. EU regulations (2021–2024) affect 20% of India’s textile exports. MSMEs find it difficult to adapt without financial support.
- Low Per Capita Fibre Consumption: Despite being a major producer, India’s fibre consumption is just 5.5 kg per capita—half the global average.
Way Forward
- Supply Chain Integration: Develop MITRA textile parks and “fibre-to-fashion” hubs to reduce costs and improve efficiency.
- Raw Material Reforms: Reassess QCOs to allow controlled imports and reduce input prices.
- Trade Policy: Secure FTAs with key markets to enhance export competitiveness.
- Labour Productivity: Set up housing near textile clusters (as in China) to improve worker efficiency and reduce attrition.
- Boost MMF Usage: Promote domestic MMF consumption through targeted incentives.
- Green Transition: Provide financial and technical support to MSMEs to adopt sustainable practices and enter the recycled textile market, projected to reach USD 400 million in India.
With structural reforms and global alignment, India’s textile industry holds immense potential to emerge as a global leader while promoting sustainable, inclusive growth.
Centring Care in India’s Economic Policy
- 06 Mar 2025
In News:
The Union Budget 2025 has seen a significant increase in the allocation for gender-responsive fiscal policies, with a record ?4,49,028.68 crore allocated to the Gender Budget (GB). This represents a 37.3% increase from the previous year, marking 8.86% of the total Budget. However, this increase is largely attributed to the inclusion of PM Garib Kalyan Anna Yojana, which constitutes 24% of the GB, rather than substantial investments in care infrastructure or gender-responsive schemes. This highlights the persistent underestimation of unpaid care and domestic work (UCDW) in India’s economic planning.
The Care Work Crisis: An Overlooked Economic Reality
Globally, women bear the brunt of unpaid care work (UCDW), spending an average of 17.8% of their time on such tasks. In India, this burden is particularly severe. Indian women spend 40% more time on UCDW compared to women in South Africa and China. As per the International LabourOrganisation (ILO), 53% of Indian women remain outside the labour force due to caregiving responsibilities, while only 1.1% of men face similar barriers. This deep-rooted gender inequality reinforces women’s economic disempowerment.
For marginalized women in low-income households, the burden is exacerbated. Many women juggle 17–19 hours of daily labour, balancing paid work with domestic duties, resulting in severe time poverty and poor health. Feminist economists from the Global South emphasize that in India, unpaid work extends beyond household care to include tasks such as family farming, water collection, and fuel gathering. Women often spend up to 73% of their time on these tasks due to limited infrastructure in basic services such as water, sanitation, and clean energy.
Missed Opportunities in the 2025 Budget
Despite the record increase in the Gender Budget, the 2025 Union Budgetmisses critical opportunities to address the care work crisis. The Economic Survey 2023-24 recognized care infrastructure as pivotal for women’s empowerment, yet the budget failed to translate this into significant fiscal commitments. The Jal Jeevan Mission (JJM), which aims to provide 100% potable water coverage by 2028, is a positive step but suffers from funding delays and implementation gaps. While the JJM budget increased by 195% over Revised Estimates, it saw a decline of 4.51% from last year’s Budget Estimates, underscoring allocation and spending mismatches.
Policy Recommendations: The Three R Framework
To address these systemic issues, the Economic Survey 2023-24 suggests that public investment of 2% of GDP in care infrastructure could generate 11 million jobs and reduce the care burden on women. The Three R framework — Recognise, Reduce, Redistribute, and Represent — provides a holistic approach to creating a more inclusive economy:
- Recognise: The first step is acknowledging the full extent of UCDW. India’s 2019 Time Use Survey revealed that women spend an average of seven hours daily on unpaid care tasks. Regular surveys, integrated into existing household surveys, can inform more effective policy-making.
- Reduce: The second step involves reducing the care burden by investing in time-saving technologies and affordable care infrastructure. Expanding childcare centres, eldercare support, and assistive technologies can facilitate women’s workforce participation. The Urban Challenge Fund announced in the 2025 Budget, with ?10,000 crore allocated for FY 2025-26, can finance urban redevelopment projects that integrate care infrastructure, inspired by successful models like Bogotá’s Care Blocks.
- Redistribute: Care responsibilities must be shifted from the household to the State and society. The Smart Cities Mission and the Urban Challenge Fund present opportunities to scale up care infrastructure in urban areas. This redistribution of care work can significantly ease the burden on women and encourage more equitable labor force participation.
- Represent: Women’s representation in decision-making is crucial for creating gender-transformative policies. Policies designed with women’s input are shown to be six to seven times more effective in achieving gender-equitable outcomes. Therefore, promoting female leadership in governance is essential for the success of gender-responsive policies.
Conclusion:
The Union Budget 2025 has made strides in gender-responsive fiscal policies but falls short in addressing the care economy. India has a significant opportunity to set a global example by recognizing unpaid care work, investing in care infrastructure, and redistributing caregiving responsibilities. A gender-sensitive economy, with women’s participation in decision-making, will not only uplift women but also ensure more inclusive growth for the country. The current budget highlights the need for a more deliberate, well-funded strategy to treat care work as a central pillar of India’s economic development.
India Philanthropy Report 2025
- 05 Mar 2025
In News:
The India Philanthropy Report 2025, a joint publication by Bain & Company and Dasra, presents an insightful overview of the evolving landscape of philanthropic giving in India. With private philanthropic funding projected to grow annually by 10–12% over the next five years, the report underlines the increasing role of family philanthropy and corporate social responsibility (CSR) in complementing public sector expenditure on social development.
Growth of Social Sector Funding
India's total social sector funding reached approximately ?25 lakh crore ($300 billion) in FY24, accounting for 8.3% of the GDP. Public funding continues to dominate, constituting 95% of the total with allocations towards flagship welfare schemes like MGNREGS and the Pradhan Mantri Awas Yojana. Private philanthropy, however, is steadily gaining ground, contributing ?1.3 lakh crore ($16 billion) in FY24, and is expected to grow significantly by FY29.
Despite this growth, a considerable funding gap persists—estimated at ?14 lakh crore in FY24 and projected to widen to ?16 lakh crore by FY29. Bridging this deficit is critical for meeting India's Sustainable Development Goals (SDGs) and the vision of Viksit Bharat@2047.
Rise of Family Philanthropy
Family philanthropy has emerged as a key driver of private social funding, accounting for around 40% of total private contributions. It spans diverse sectors including education, healthcare, gender equity, diversity and inclusion (GEDI), climate action, and social justice. Notably, 55% of family philanthropic initiatives are women-led, and around one-third involve next-generation leadership, indicating a shift towards more inclusive and innovative giving.
Structured philanthropy is becoming more prominent, with nearly 65% of family-run initiatives now managed by professional teams. The report projects that by building robust advisory infrastructure and tapping into family offices, India can unlock an additional ?50,000–55,000 crore ($6–$7 billion) in family philanthropy over the next five years.
Corporate Social Responsibility: Compliance and Concentration
Corporate Social Responsibility (CSR) spending, mandated under the Companies Act, is another critical pillar. CSR expenditure is growing at a projected 10–12% per annum, driven by increased compliance and strategic integration into corporate goals. The number of CSR-compliant firms rose from 12,000 in FY22 to around 15,000 in FY23.
Family-owned businesses contribute nearly 65%–70% of total private CSR spending, with major conglomerates like Tata, Adani, Birla, and Ambani alone accounting for ?800–1,000 crore each annually. However, the sector remains top-heavy: just 2% of family-owned firms are responsible for over half of all CSR contributions.
HNIs, UHNIs, and the Philanthropic Disparity
Despite the promising trends, Indian High-Net-Worth Individuals (HNIs) and Ultra-High-Net-Worth Individuals (UHNIs) still contribute a relatively small fraction of their wealth towards philanthropy. Indian UHNIs donate only 0.1%–0.15% of their wealth, compared to 1.2%–2.5% in the US, 0.5%–1.8% in the UK, and 0.5%–1.4% in China.
In FY24, average annual philanthropic contributions from UHNIs (net worth ?1,000 crore and above) hovered around ?5 crore, while HNIs (?200–1,000 crore) contributed ?0.4–?5 crore. This indicates a large untapped potential that can significantly bolster India's development financing.
Institutionalization and Diaspora Potential
The number of family offices—dedicated institutions managing family wealth and philanthropy—has increased from 45 in 2018 to 300 in 2024, with projections to cross 500 by 2029. Institutions like Dasra, Sattva, and Bridgespan have been instrumental in supporting structured and high-impact philanthropy.
India’s diaspora, growing from 18 million in 2019 to 35 million in 2024, also presents a significant but underutilized opportunity. While diaspora philanthropy is estimated at $130 billion currently, better awareness, simplified compliance norms, and digital platforms could enhance its impact and push the potential closer to $200 billion.
Challenges and the Way Forward
Despite the optimistic outlook, several challenges hinder the full realization of philanthropic potential in India:
- Persistent funding gaps in critical sectors like healthcare, education, and climate change.
- Regulatory and compliance barriers, especially affecting foreign and diaspora contributions.
- Fragmented infrastructure, with limited advisory services and high transaction costs.
- Short-term funding models, with only 23% of family philanthropies combining grants with direct program implementation, undermining sustainable impact.
To address these, the report suggests:
- Promoting long-term funding mechanisms, including multi-year grants.
- Professionalizing philanthropy through structured advisory services and capacity building.
- Unlocking diaspora contributions via simplified regulations and dedicated philanthropic platforms.
- Enhancing collaboration across stakeholders to amplify social impact and innovation.
Conclusion
The India Philanthropy Report 2025 underscores the transformative potential of private giving, particularly through family philanthropy and CSR. While public funding remains the bedrock of India’s social development agenda, strengthening the philanthropic ecosystem—by leveraging wealth, institutions, and global networks—is vital to achieving equitable growth and meeting national development goals.
India’s Roadmap to High-Income Status by 2047
- 04 Mar 2025
In News:
India, currently classified as a lower-middle-income economy with a Gross National Income (GNI) per capita of USD 2,540 (2023), aspires to achieve high-income status by 2047, coinciding with the centenary of its independence. A recent World Bank report titled “Becoming a High-Income Economy in a Generation” outlines the necessary reforms, challenges, and growth scenarios India must navigate to meet this ambitious target.
Growth Imperatives and Economic Targets
To transition into a high-income economy, India must sustain an average real GDP growth rate of 7.8% annually until 2047, raising its GNI per capita nearly eightfold. Historically, India grew at 6.3% (2000–2024) and has become the world’s fifth-largest economy, doubling its global share to 3.4%. However, "business-as-usual" growth (6.6%) will fall short, and only accelerated reforms can enable a successful transition—something achieved by few countries like Chile and Poland.
Key Policy Areas for Reform
- Boosting Investment and Capital Formation:
- Increase total investment from 33.5% to 40% of GDP by 2035 through public-private synergy.
- Address infrastructure deficits, streamline land acquisition, and liberalize FDI norms.
- Improve financial markets to support long-term infrastructure and SME financing.
- Enhancing Labor Force Participation:
- Raise overall labor force participation from 56.4% to 65%.
- Increase female workforce participation from 35.6% to 50% by addressing socio-economic barriers and improving childcare and safety infrastructure.
- Target job-rich sectors like manufacturing, logistics, hospitality, and care economy to generate employment.
- Structural Transformation and Trade Integration:
- Shift labor from agriculture (currently employing 45% of workforce) towards manufacturing and services.
- Boost India's Global Value Chain (GVC) participation by reducing high tariffs and non-tariff barriers, particularly on intermediate and capital goods.
- Simplify customs, improve regulatory clarity, and promote technological adoption across sectors.
- Promoting Balanced Regional Growth:
- Support low-income states in developing healthcare, education, and infrastructure.
- Deepen industrial reforms and trade competitiveness in developed states through federal programs like the Urban Challenge Fund.
- Strengthening Human Capital and Innovation:
- Expand vocational training and R&D investments in emerging areas such as AI, biotechnology, and clean energy.
- Encourage entrepreneurship and formalization to reduce the high informal employment rate (73%).
Challenges on the Path
India faces slowing investment rates (down from 35.8% in 2008 to 27.5% in 2024), low FDI inflows (just 1.6% of GDP), and declining trade openness (exports and imports fell from 56% of GDP in 2012 to 46% in 2023). Regulatory unpredictability and complex business processes hinder private investment.
Conclusion
India’s vision to become a high-income economy by 2047 is ambitious yet attainable, contingent on sustained growth, robust reforms, and inclusive development. Strategic policy execution in trade, labor, investment, and federal cooperation will be critical to transforming India's economic trajectory and positioning it as a global leader by its centenary year.
Farmers’ Share in Consumer Prices for Rabi Crops

- 02 Mar 2025
In News:
The Reserve Bank of India (RBI) conducted a comprehensive pan-India survey during May–July 2024 to assess the farmers’ share in consumer prices for 12 major rabi crops. The survey spanned mandis and villages across 86 centres in 18 states, and included detailed inputs from farmers, traders, and retailers, with over 10,699 respondents.
Key Findings:
- Farmers’ Share in Consumer Prices:
- Ranged between 40% and 67% across rabi crops.
- Wheat farmers received the highest share (67%), attributed to its status as a notified commodity under the public procurement system; about 25% of wheat farmers sold at Minimum Support Price (MSP).
- Rice farmers received 52%, a figure consistent over previous surveys (49% in 2018, 45% in 2022), indicating stability.
- In pulses, lentil (masoor) farmers earned 66%, and gram (chana) farmers earned 60% of the retail price.
- In oilseeds, mustard farmers received 52%, slightly lower than the 55% found in a 2021 study.
- Perishables vs Non-Perishables:
- Fruits and vegetables showed lower farmer share (40–63%), due to their perishability, seasonal production, and logistical challenges.
- The combined markup of traders and retailers exceeded 50% in most perishable crops (except tomatoes).
- Perishables face higher post-harvest losses, quality variation, and price volatility due to climate dependency and demand-supply fluctuations.
Supply Chain and Payments:
- The agriculture supply chain remains unorganized, especially for fruits and vegetables, with multiple intermediaries reducing transparency in pricing, logistics, and fund flows.
- Retailer markups were typically higher than those of traders. An empirical analysis showed that:
- Higher transaction costs (e.g., transport, labour) reduce retailer markups.
- High post-harvest losses in perishables allow markups to be passed on to consumers.
Digital Transactions:Though cash transactions still dominate, the adoption of electronic payments saw a significant rise in 2024 across all stakeholders compared to previous surveys in 2018 and 2022.
Policy Implications:
- A higher farmers’ share is essential to:
- Enhance farm incomes
- Incentivise crop diversification, particularly from cereals to pulses and oilseeds
- Improve transparency in the agri-supply chain
- Strengthening public procurement, digital infrastructure, and organised logistics are vital for ensuring fair price realisation by farmers.
Sovereign Green Bonds in India
- 20 Feb 2025
Context:
India has adopted sovereign green bonds (SGrBs) as a key strategy to finance its transition to a low-carbon economy. However, these bonds have faced muted demand from investors, limiting the effectiveness of this funding source. Despite efforts to ease participation rules and attract foreign investors, the expected "greenium" (lower borrowing costs) remains weak, leading to funding shortfalls for vital green projects.
What are Sovereign Green Bonds?
Sovereign Green Bonds are issued by the government to raise capital for environmentally sustainable projects such as renewable energy, energy efficiency, and climate resilience. In India, the government established a framework for issuing these bonds in 2022. Since their introduction, India has raised nearly Rs 53,000 crore through eight issuances, with funds primarily allocated to projects like energy-efficient locomotives and metro developments.
Weak Investor Demand
Despite the government's efforts, India's SGrBs have struggled to attract investor interest. A significant issue is the limited greenium, which in India has only reached 2–3 basis points, far below the global average of 7–8 basis points. This lack of financial incentive makes these bonds less attractive compared to regular bonds. Additionally, small issue sizes and limited secondary market trading further discourage investors. Many bonds are held to maturity, stifling liquidity and market participation.
Impact on Green Initiatives
The weak demand for SGrBs has directly impacted the funding for critical green projects. Initially, India planned to raise Rs 32,061 crore from SGrB proceeds in 2024-25. However, after weak investor response, the revised estimate was reduced to Rs 25,298 crore, resulting in significant cuts to funding for projects such as grid-scale solar energy. The budget for grid-scale solar projects was slashed from Rs 10,000 crore to just Rs 1,300 crore. As a result, India is increasingly relying on general revenue to fill the funding gap.
Key Areas Affected by Funding Cuts
- Electric Locomotive Manufacturing: Rs 12,600 crore
- Metro Projects: Rs 8,000 crore
- Renewable Energy (including National Green Hydrogen Mission): Rs 4,607 crore
- Afforestation (National Mission for a Green India): Rs 124 crore
Challenges Contributing to Weak Demand
- Lack of Social Impact Funds: India lacks a robust ecosystem of social impact funds and responsible investment mandates, which are present in other markets and drive demand for green bonds.
- Liquidity Issues: Small bond issues and a lack of secondary market trading have made SGrBs less liquid and attractive to investors.
- Higher Yields in Other Investment Avenues: Investors are reluctant to accept the relatively low yields of SGrBs, as they offer little financial advantage over regular bonds.
Way Forward
To improve the attractiveness of SGrBs, India could explore the issuance of sustainability bonds, which fund both green and social projects, attracting a broader base of investors. Additionally, post-issuance transparency is crucial, with detailed allocation and impact reports needed to build investor confidence. The government can also collaborate with multilateral development banks like the World Bank to back its green bonds, enhancing their credibility and attracting investment.
Furthermore, enhancing liquidity and developing a more robust market for green finance are essential steps to ensure that India can achieve its climate goals. With proper strategy and structural changes, India can enhance investor confidence and ensure sustainable funding for its green initiatives.
India's Horticulture Sector

- 19 Feb 2025
In News:
India’s horticulture sector is crucial to its agricultural economy, encompassing the cultivation, production, processing, and marketing of fruits, vegetables, and ornamental plants. The sector includes sub-sectors like pomology (fruit cultivation), olericulture (vegetable cultivation), floriculture (flower cultivation), and arboriculture (cultivation of trees). India stands as the second-largest producer of fruits and vegetables globally, trailing only China.
In 2023-24, India’s horticultural production was estimated at 355 million tonnes, surpassing food grain production. The sector contributes 33% to the agricultural Gross Value Added (GVA), growing at an annual rate of 4-5%, outpacing cereal production.
Despite its size and importance, India’s horticulture sector faces several challenges. Post-harvest losses are significant, with about 8.1% for fruits and 7.3% for vegetables, translating into a loss of ?1.53 trillion annually. These losses are primarily due to inadequate cold storage and processing infrastructure, as well as fragmented value chains, where middlemen dominate, resulting in low farmer incomes. Farmers typically receive only 30% of the final consumer price for their produce.
Challenges in India’s Horticulture Sector
- Infrastructure Deficit: The absence of efficient logistics, cold storage, and warehousing facilities contributes to delays and wastage of perishable horticultural crops. The cold storage capacity is concentrated in just a few states, limiting access for farmers across the country.
- Small Operational Landholdings: Many farmers operate on small plots, limiting their ability to adopt sustainable practices and crop rotation, leading to reduced yields and soil degradation.
- Limited Value Addition: Only 10% of India’s fruits and vegetables are processed, compared to 60-70% in developed countries, leading to distress sales and low earnings for farmers.
- Market Linkages and Export Challenges: Indian farmers have limited access to direct markets, and the country’s export share in horticultural produce is low. Non-tariff barriers such as Sanitary and Phytosanitary (SPS) standards also hinder India's export growth.
Government Initiatives for Horticulture
Several initiatives have been launched to address these challenges:
- Mission for Integrated Development of Horticulture (2014) aims to foster holistic growth through cluster approaches and better linkages.
- Operation Greens, initially focused on specific crops like tomatoes, onions, and potatoes, has been extended to all horticultural crops to address price volatility.
- The Farmer Producer Organisation (FPO) model is being promoted to help farmers collectively bargain for better prices. As of August 2024, 8,875 FPOs have been established with a target of 10,000 by 2027.
- The Agriculture Infrastructure Fund (AIF) provides financial support for cold chains, warehouses, and processing units.
Case Study: Sahyadri FPO
A notable example of FPO success is the Sahyadri Farmer Producer Company Ltd (SFPCL) in Maharashtra, which started with 10 farmers in 2004 and has grown to include 26,500 farmers across 252 villages. With an annual turnover of ?1,549 crore (2023-24), SFPCL has become the largest grape exporter, with 90% of exports going to the EU and UAE. Farmers involved in the FPO receive 55% of the final export price, significantly higher than the typical 30% in traditional markets. This model demonstrates the potential of cooperative farming in enhancing farmers' incomes.
Way Forward: Scaling Up the Amul Model
To replicate the success of AMUL in the dairy sector, India’s horticulture sector must focus on:
- Strengthening FPOs: Support should be provided for working capital, infrastructure, and digital integration. Leveraging platforms like the Open Network for Digital Commerce (ONDC) can enhance market access for FPOs.
- Expanding Processing and Storage Infrastructure: Financial allocation for cold storage, processing facilities, and logistics must be increased under schemes like Operation Greens.
- Public-Private Partnerships (PPP): Encourage collaborations between the government and private sectors to enhance food processing, distribution, and retail linkages.
- Technology Integration: Adoption of technologies like blockchain for traceability and AI-driven price prediction models can improve market transparency and reduce distress sales.
By expanding successful models like Sahyadri FPO, India can transform its horticulture sector, enhance farmer incomes, ensure food security, and increase agri-export earnings. This approach could play a pivotal role in rural development and poverty alleviation, benefiting both farmers and consumers.
India’s Sovereign Green Bonds: Challenges and Prospects

- 18 Feb 2025
Context:
India’s Sovereign Green Bonds (SGrBs) are a key instrument to mobilize resources for climate-resilient infrastructure and sustainable development. However, despite their potential, the bonds have struggled to attract robust investor interest, thereby limiting the government’s ability to secure a meaningful greenium—a lower cost of borrowing that typically incentivizes green finance globally.
What are Sovereign Green Bonds?
SGrBs are debt instruments issued by the Government of India to raise capital for projects that contribute to environmental sustainability and low-carbon development. They are part of India’s broader green financing strategy to meet its Net Zero target by 2070. These bonds are issued by the Ministry of Finance, under the oversight of the Department of Economic Affairs (DEA), and are guided by India’s Green Finance Framework, aligned with global green bond principles.
Application of Funds:
The proceeds from SGrBs are earmarked exclusively for green projects, ensuring transparency and impact-based investment. Key sectors financed include:
- Electric Locomotive Manufacturing (largest beneficiary through the Ministry of Railways)
- Urban Mobility: Metro rail and public transport systems
- Renewable Energy: Solar, wind, and the National Green Hydrogen Mission
- Afforestation: Under the National Mission for a Green India
- Grid-Scale Solar Projects, though allocations here have been curtailed due to fiscal constraints
Performance and Allocation Trends:
India raised ?16,000 crore through SGrBs in FY 2022–23 and ?20,000 crore in FY 2023–24. For FY 2024–25, ?16,697 crore has been raised so far. However, due to muted investor demand, the revised fundraising estimate has been reduced from ?32,061 crore to ?25,298 crore. A fiscal gap of ?3,600 crore will be met through general revenue, reflecting limited success in expanding green finance.
Challenges:
- Weak Greenium: Indian SGrBs offer little to no financial advantage over conventional bonds, with greenium as low as 2–3 basis points. Globally, it averages 7–8 basis points, still modest but relatively attractive.
- Low Investor Demand: Several bond auctions witnessed under-subscription. For instance, ?7,443 crore worth of bonds were devolved to primary dealers in recent auctions due to high yield expectations from investors.
- Illiquid Secondary Market: Small issuance sizes and a trend of holding bonds till maturity restrict active trading, deterring market participants.
- Underdeveloped Sustainable Finance Ecosystem: India lacks dedicated ESG funds, responsible investment mandates, or regulatory incentives for green bond investments.
Recommendations:
- Enhance Credit Guarantees: Collaborate with multilateral institutions like the World Bank or IFC to back green bonds, enhancing their creditworthiness.
- Expand Domestic Green Investment Base: Promote ESG-focused mutual funds, offer tax incentives, and establish a regulatory framework to attract long-term green capital.
- Improve Market Liquidity: Increase bond issuance sizes and introduce market-making mechanisms to deepen secondary market activity.
- Leverage Public-Private Partnerships: Engage private players in project implementation to diversify and scale up green investment opportunities.
Conclusion:
India’s Sovereign Green Bonds symbolize a strategic shift toward sustainable development financing. While challenges persist, especially in market participation and pricing incentives, strengthening domestic financial ecosystems and leveraging global support can make green bonds a cornerstone of India’s climate financing roadmap.
Reforming Banking Regulations for a $7 Trillion Indian Economy
- 14 Feb 2025
In News:
India’s GDP is projected to nearly double from $3.7 trillion in 2023–24 to $7 trillion by 2030–31, driven by strong digital infrastructure, financial inclusion, and supportive fiscal policies. However, to sustain this growth, robust capital formation and increased credit flow are essential.
The current banking regulatory architecture—comprising Statutory Liquidity Ratio (SLR), Cash Reserve Ratio (CRR), Liquidity Coverage Ratio (LCR), andPriority Sector Lending (PSL)—while ensuring stability, also constrains banks’ lending capacity, particularly for the private sector and MSMEs.
Investment Needs and Private Sector Slowdown
India needs $2.5 trillion in investments, demanding an investment-to-GDP ratio of 34%. Public investment alone is insufficient due to fiscal deficit constraints, necessitating greater reliance on private capital and household savings. However, the investment-to-operating cash flow ratio for the private sector has declined from 114% in 2008–09 to 56% in 2023–24, reflecting weakening investment appetite.
Challenges in Financial Intermediation
Banks’ share in household financial savings has declined from 50% to 40%, as savers turn to higher-yield options like mutual funds. Simultaneously, banks face high regulatory pre-emptions, holding nearly 30% of deposits as non-lendable reserves, including:
- SLR (~26%), exceeding the mandated 18% due to LCR constraints,
- CRR (4%), which earns no interest.
These requirements reduce lendable resources, raise borrowing costs, and constrain credit growth, especially for MSMEs. Further, upcoming LCR norms for digital deposits could require banks to allocate 2–2.5% more to liquid assets, limiting credit availability further.
Need to Rationalize Regulations
Globally, LCR is the standard liquidity norm, but India uniquely mandates both SLR and LCR, leading to excessive capital retention in low-yield instruments. Additionally, India’s exclusion of CRR from High-Quality Liquid Assets (HQLA) reduces bank profitability. While Basel III emphasizes flexible, institution-specific liquidity planning, the RBI’s rigid mandates hinder optimal resource deployment.
Liquidity Access and MSME Credit Gap
Large corporates can access capital via equity and bond markets, but MSMEs remain dependent on bank credit, facing persistent shortages. PSL norms, which account for over 60% of bank lending, can distort credit risk pricing and misallocate capital. A revision is needed to align PSL with India’s changing economic structure.
Credit Growth and Exchange Rate Management
India’s credit growth lags nominal GDP growth, signaling underinvestment and risks to financial stability. Revisiting the credit-to-deposit (CD) ratio can help banks raise capital more efficiently. Meanwhile, defending the rupee against a strong dollar has drained liquidity without addressing currency overvaluation, which continues to hurt export competitiveness.
Way Forward
- Rationalize SLR and LCR mandates to unlock liquidity and lower interest rates.
- Revise PSL norms to reflect new growth priorities.
- Stimulate private investment through policy stability and ease of doing business.
- Deepen bond markets to diversify capital sources.
- Align digital banking fees with global norms for viability.
Conclusion
India stands at a critical juncture in its economic transformation. Reforms in banking regulation, better financial intermediation, and improved credit access are pivotal to achieving the vision of a $7 trillion economy. A forward-looking regulatory framework will empower banks to act as true engines of inclusive and sustained growth.
RBI Monetary Policy Committee (MPC) cuts Repo Rate
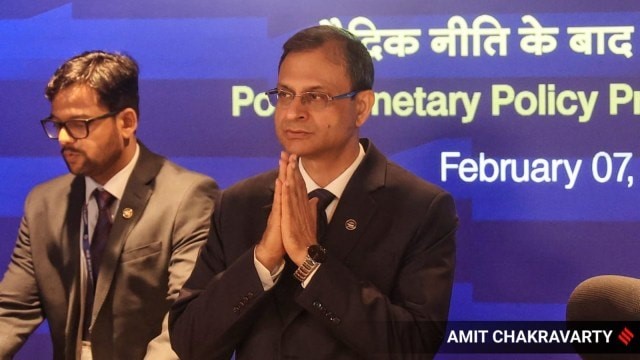
- 09 Feb 2025
In News:
In a landmark decision during its February 2025 meeting, the Reserve Bank of India’s (RBI) Monetary Policy Committee (MPC) reduced the repo rate by 25 basis points, from 6.5% to 6.25%, marking the first rate cut in five years (since May 2020). This move follows the Union Government’s recent cut in personal income tax, aimed at boosting consumption.
What is the Monetary Policy Committee (MPC)?
The MPC is a six-member statutory body responsible for setting India’s monetary policy. Its primary objective is price stability while ensuring economic growth. It meets bi-monthly to assess economic indicators and modify key policy rates like the repo rate, which influences overall borrowing and lending costs in the economy.
Key Highlights from the MPC Decision:
Repo Rate Cut:
- Reduced to 6.25% from 6.5%.
- Objective: Stimulate credit growth, investment, and consumer demand.
- Expected Impact: Lower EMIs for borrowers, reduced interest rates on EBLR and MCLR-linked loans.
GDP Growth Outlook (FY26):
- RBI projects 6.7% GDP growth for FY26.
- This is slightly higher than the FY25 estimate of 6.4%, and in line with the Economic Survey’s projection of 6.3–6.8%.
- Growth recovery is attributed to calibrated fiscal consolidation and stable private consumption.
Inflation Projections (CPI-based):
- FY26 Inflation Estimate: 4.2%
- Q1: 4.5%
- Q2: 4.0%
- Q3: 3.8%
- Q4: 4.2%
- CPI inflation had already dropped to 5.22% in December 2024, aided by easing food prices.
- RBI emphasized continued transmission of past policy measures and food price moderation as drivers of disinflation.
Broader Monetary Policy Context
- RBI will maintain a “neutral” policy stance to remain flexible amid evolving macroeconomic conditions.
- RBI Governor Sanjay Malhotra stressed that the inflation-targeting framework has helped stabilize prices, especially post-pandemic.
- The policy space was created by the simultaneous drop in inflation and moderate growth, allowing support for the economy without derailing price stability.
Cybersecurity & Digital Measures
- Additional Factor Authentication (AFA) introduced for international digital payments.
- Launch of exclusive domains:
- "bank.in" for Indian banks
- "fin.in" for the wider financial sector
These aim to bolster digital transaction security amid rising cyber fraud.
Forex & External Sector Outlook
- RBI reiterated that it does not target exchange rate levels, intervening only to curb excessive volatility.
- Ongoing global challenges include:
- Strengthening of the US dollar
- Higher bond yields
- Geopolitical tensions
- Threat of trade wars
- These have led to capital outflows, currency depreciation, and increased financial market volatility.
Conclusion
The RBI’s rate cut signals a strategic shift towards supporting economic growth amid global uncertainties. With a moderate inflation outlook and improving macroeconomic indicators, the decision is expected to boost domestic demand and investment, while reinforcing RBI’s commitment to price and financial stability.
MSMEs in India’s Economic Growth
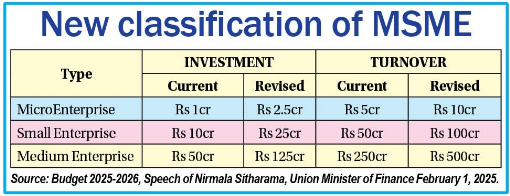
- 07 Feb 2025
In News:
In the Union Budget 2025–26, the Finance Minister proposed a significant policy shift by increasing the investment and turnover limits for MSME classification by 2.5 and 2 times respectively. This move is expected to enhance the growth prospects and scalability of India’s micro, small, and medium enterprises (MSMEs).
Economic Significance:
The MSME sector forms the backbone of the Indian economy, contributing 30% to the GDP and nearly 45% to manufacturing output. With over 1 crore registered units employing 7.5 crore people, it is the largest source of non-agricultural employment in the country. It plays a pivotal role in inclusive development, offering livelihood opportunities to the rural, urban poor, and semi-skilled workforce.
The formalization drive has been significant, with over 4 crore MSMEs registered on the Udyam portal by March 2024. Key schemes like PM Vishwakarma Yojana (?13,000 crore) and Mudra Yojana (?5.41 lakh crore disbursed in FY24) have supported artisans and first-time entrepreneurs, particularly women and marginalized communities.
Boost to Trade and Innovation:
MSMEs account for 45.73% of India’s total exports in sectors like textiles, leather, and engineering goods. Their integration into Global Value Chains (GVCs) is being facilitated by reforms in trade logistics, the GeM portal, and PLI schemes. Digital transformation is advancing rapidly, with 72% MSME transactions now digital, supported by platforms like ONDC and the RBI’s Public Tech Platform.
Women and Rural Empowerment:
Women entrepreneurs constitute 20.5% of Udyam registrations, and 68% of Mudra loans benefit them. MSMEs are also catalyzing rural industrialization by promoting agro-processing and curbing rural-urban migration through schemes like the SRI Fund and Animal Husbandry Credit Guarantee Scheme.
Key Challenges:
Despite their potential, MSMEs face critical bottlenecks:
- Credit access remains limited; only 20% of units access formal finance. Payment delays amounting to ?10.7 lakh crore (2022) hinder working capital.
- Regulatory burdens, inadequate infrastructure, and poor digital skills further constrain productivity.
- Low awareness of schemes and limited integration into global ESG standards affect competitiveness.
- The sector remains largely informal, weakening labor rights and policy outreach.
Recent Reforms & Recommendations:
To unlock MSMEs’ potential, a multi-pronged reform strategy is underway:
- Credit Measures: Promotion of cash-flow based lending, expansion of CGTMSE, Vyapar Credit Cards, and enhanced TReDS-GeM integration.
- Ease of Doing Business: Single-window clearances, self-certification, and stronger MSME facilitation councils.
- Digital & Skill Upgradation: Launch of Digital MSME 2.0, apprenticeship hubs, and innovation incubators.
- Market Access: Expansion of cluster-based models, branding support, and ONDC-GeM integration.
- Green MSMEs: ESG-linked credit, circular economy incentives, and green certifications.
- Formalization Push: Linking benefits to Udyam registration, backed by SIDBI-led equity support.
Conclusion:
MSMEs are central to India’s vision of a $5 trillion economy and Viksit Bharat by 2047. With increased investment thresholds, focused policy interventions, and digital empowerment, India can build a resilient, inclusive, and globally competitive MSME ecosystem.
RBI’s Liquidity Infusion of ?1.5 Lakh Crore

- 04 Feb 2025
In News:
In January 2025, the Reserve Bank of India (RBI) announced its largest monetary easing since the COVID-19 pandemic, unveiling a multi-pronged plan to inject over ?1.5 lakh crore into the money markets.
This move aims to address liquidity shortfalls caused by RBI’s forex interventions and signal possible easing in the upcoming monetary policy review.
Context: Why Liquidity Infusion Was Needed
- Forex Intervention: RBI sold over $50 billion from its foreign exchange reserves to stabilise the rupee, in response to large-scale equity sell-offs by Foreign Institutional Investors (FIIs).
- Impact: These interventions reduced rupee liquidity, tightened short-term interest rates, and raised borrowing costs.
- Liquidity Deficit: Market estimates pegged the shortfall at ?3 lakh crore.
Key Liquidity Measures Announced by RBI
- Government Bond Buy-Back: ?60,000 Crore
- Conducted in three tranches on January 30, February 13, and February 20, 2025.
- Objective: To inject liquidity into the banking system by repurchasing government securities before maturity.
- 56-Day Variable Rate Repo Auction: ?50,000 Crore
- Scheduled for February 7, 2025.
- Enables banks to borrow short-term funds by offering government securities as collateral at a market-determined interest rate.
- USD/INR Buy-Sell Swap Auction: $5 Billion
- A six-month forex swap in which RBI borrows dollars in exchange for rupees and agrees to buy them back later.
- Helps stabilize the rupee without draining rupee liquidity.
Significance of the Measures
- Monetary Transmission: With adequate liquidity, any potential repo rate cut will be more effectively transmitted through lower lending rates, boosting investment and consumption.
- Financial Stability: By calming money markets and moderating borrowing costs, RBI strengthens confidence amid global uncertainties.
- Rupee Management without Liquidity Squeeze: The forex swap allows rupee liquidity to remain intact while addressing exchange rate volatility.
Governor’s Focus Areas:
In a meeting with private sector bank heads ahead of the February monetary policy review, RBI Governor Sanjay Malhotra highlighted the following priorities:
- Financial Stability & Inclusion
- Enhanced Digital Literacy and Credit Access
- Improved Customer Service & Grievance Redressal
- Cybersecurity & IT Risk Management
- Monitoring of Third-party Service Providers
- Countering Rising Digital Fraud
Union Budget 2025–26
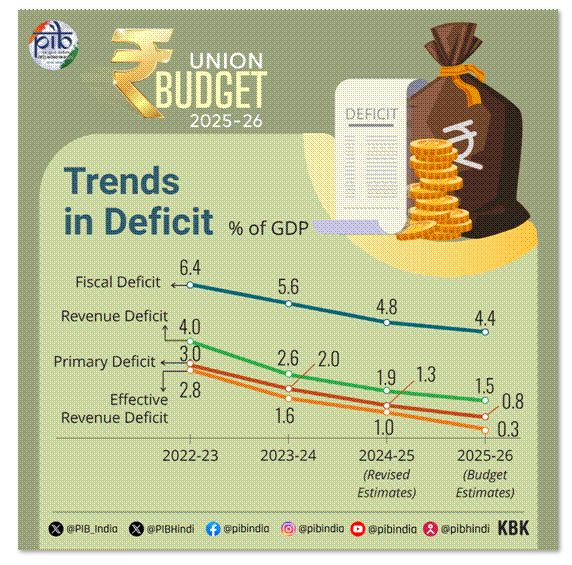
- 03 Feb 2025
In News:
Union Minister for Finance and Corporate Affairs Smt Nirmala Sitharaman presented Union Budget 2025-26 in the Parliament.
Key Highlights:
Fiscal Policy and Macroeconomic Indicators
- Total Expenditure: ?50.65 lakh crore
- Total Receipts (excl. borrowings): ?34.96 lakh crore
- Fiscal Deficit: 4.4% of GDP
- Gross Market Borrowing: ?14.82 lakh crore
- Capital Expenditure: ?11.21 lakh crore (3.1% of GDP)
Agriculture and Allied Sectors
- Prime Minister Dhan-Dhaanya Krishi Yojana: 100 low-productivity districts targeted; 1.7 crore farmers to benefit.
- Mission for Aatmanirbharta in Pulses: 6-year mission on Tur, Urad, and Masoor; NAFED/NCCF to procure for 4 years.
- Vegetables & Fruits Program: Comprehensive initiative for production, pricing, processing, and logistics.
- Makhana Board: New board in Bihar for production, value addition, and export.
- National Mission on High Yielding Seeds: To commercialize over 100 high-yielding seed varieties.
- Cotton Mission: 5-year initiative to boost productivity and Extra Long Staple (ELS) varieties.
- Fisheries: New EEZ and High Seas Framework focusing on Islands.
- Credit through KCC: Loan limit increased from ?3 lakh to ?5 lakh.
- Urea Plant in Assam: New plant at Namrup (12.7 lakh MT annual capacity).
MSMEs and Startups
- MSME Classification: Investment and turnover limits doubled (2.5x & 2x).
- Credit Cards for Micro Units: ?5 lakh limit; 10 lakh cards in year one.
- ?10,000 Cr Fund of Funds for Startups
- First-Time Entrepreneurs Scheme: Loans up to ?2 crore for 5 lakh women, SC/ST entrepreneurs.
- Footwear & Leather Sector Scheme: Aims ?4 lakh crore turnover and 22 lakh jobs.
- Toy Manufacturing Support: High-quality, eco-friendly toy ecosystem.
- Food Tech Institute: To be established in Bihar.
- National Manufacturing Mission: Across small, medium, and large units.
Infrastructure and Investment
- PPP Pipeline: 3-year project pipeline to be announced.
- ?1.5 lakh crore 50-year interest-free loans to states for CapEx.
- Urban Challenge Fund: ?1 lakh crore outlay; ?10,000 crore for FY26.
- Asset Monetization Plan 2025–30: Capital recycling worth ?10 lakh crore.
- Jal Jeevan Mission: Extended to 2028 with enhanced outlay.
- UDAN 2.0: Targeting 120 new destinations, 4 crore passengers in 10 years.
- Maritime Development Fund: ?25,000 crore; up to 49% govt contribution.
- Nuclear Energy Mission: ?20,000 crore outlay for Small Modular Reactors (SMRs).
- Greenfield Airports: Announced for Bihar.
Welfare and Social Security
- Saksham Anganwadi & Poshan 2.0: Enhanced nutritional cost norms.
- Medical Education: 10,000 new MBBS seats; 75,000 in 5 years.
- Day Care Cancer Centres: In all district hospitals; 200 in FY26.
- PM SVANidhi Revamp: ?30,000 UPI-linked credit cards.
- Online Platform Workers: E-Shram ID, PMJAY coverage.
- Urban Livelihood Scheme: For sustainable urban worker incomes.
Education and Skilling
- 50,000 Atal Tinkering Labs: Govt schools in 5 years.
- Bharatiya Bhasha Pustak Scheme: Digital books in Indian languages.
- National Skilling Centres of Excellence: With global partners.
- AI in Education: Centre of Excellence with ?500 crore outlay.
- IIT Expansion: Additional capacity for 6,500 students.
Innovation and R&D
- ?20,000 crore Innovation Fund (private-led R&D).
- Deep Tech Fund of Funds: For next-gen startups.
- PM Research Fellowships: 10,000 fellowships with higher support.
- 2nd Gene Bank: 10 lakh germplasm lines for food security.
- National Geospatial Mission
- Gyan Bharatam Mission: Conservation of 1 crore+ manuscripts.
Exports and Trade
- Export Promotion Mission: With ministerial and sectoral targets.
- BharatTradeNet (BTN): Unified platform for trade finance and docs.
- GCC Framework: Promote Global Capability Centres in Tier-2 cities.
Financial Sector Reforms
- FDI in Insurance: Raised from 74% to 100% for domestic investment.
- NaBFID Credit Enhancement Facility: For infra bonds.
- Grameen Credit Score: For SHGs and rural borrowers.
- Investment Friendliness Index: To rank states in 2025.
- Jan Vishwas Bill 2.0: Decriminalization of 100+ provisions.
- Tonnage Tax Extended: To inland vessels.
- Startups: Tax benefit eligibility extended to incorporation by 1 April 2030.
Taxation Reforms
Direct Taxes
- No Personal Tax: Income up to ?12 lakh (?12.75 lakh for salaried) under new regime.
- Revised Tax Slabs (New Regime):
- 0–4L: Nil | 4–8L: 5% | 8–12L: 10%
- 12–16L: 15% | 16–20L: 20% | 20–24L: 25% | 24L+: 30%
- Standard Deduction: ?75,000
- Compliance Relief: Trusts registration extended to 10 years.
- TDS/TCS Rationalization: Fewer thresholds, higher limits for senior citizens and rent.
- Tax Certainty: Safe harbour rules, startup extensions, presumptive taxation for electronics.
Indirect Taxes
- Tariff Rationalization: Only 8 remaining tariff rates.
- Customs Relief: ?2,600 crore forgone, key lifeline drugs exempted.
- Support to Domestic Manufacturing:
- EV/mobile battery manufacturing: 63 capital goods exempted
- Ships: BCD exemption extended for 10 years
- Marine, leather, textiles: Several BCD reductions/exemptions
- Voluntary Compliance Scheme: Without penalty for post-clearance corrections.
Geo-Economic Fragmentation (GEF)

- 02 Feb 2025
In News:
Geo-economic fragmentation refers to a policy-driven reversal of global economic integration, increasingly shaped by geopolitical alignments. It signifies a shift from globalization to strategically-driven economic blocs, where nations prioritize political alliances over market efficiency.
Key Characteristics
- Emergence of friend-shoring, re-shoring, and economic nationalism.
- Fragmentation of trade, capital flows, FDI, and migration.
- Retreat from multilateralism, with institutions like the WTO and IMF under stress.
- Strategic use of environmental, labor, and social standards by developed countries to impose uniform regulations, causing tensions.
Globalization to Fragmentation: Statistical Evidence
- Trade-to-GDP Ratio: Increased from 39% (1980) to 60% (2012); now threatened by rising protectionism.
- FDI Inflows: Rose from $54 billion (1980) to $1.5 trillion (2019); now increasingly concentrated among like-minded countries.
- Global Economy: Expanded from $11 trillion (1980) to over $100 trillion (2022).
- Trade Restrictions (WTO Report):
- 2023–24: 169 new measures covering $887.7 billion in trade.
- 2022–23: Covered $337.1 billion — shows a dramatic rise in protectionism.
- Over 24,000 new trade and investment restrictions imposed globally between 2020–24.
IMF on Costs of GEF
- Trade fragmentation could cause 0.2% to 7% GDP losses, especially for developing countries.
- Current fragmentation is more costly than Cold War era, as trade now constitutes 45% of global GDP (vs. 16% then).
- Less trade = less knowledge diffusion, innovation, and productivity gains.
Strategic Impacts: Global Supply Chains
China’s Dominance
- 80% of global battery manufacturing.
- 80% of solar panel components.
- 60% of wind turbine capacity.
- 70% of global rare earth mineral processing.
- Dominates EV supply chains, critical mineral refining, and clean energy manufacturing.
FDI Realignment
- FDI is increasingly relocating from China to India, Vietnam, Mexico, etc.
- Friend-shoring reduces capital access for emerging markets.
- Emerging economies face reduced FDI, slower growth, and technological decoupling.
India’s Strategic Response: Deregulation and Internal Growth
Policy Recommendations (Economic Survey 2024–25)
- Amplify deregulation to lower compliance costs and boost entrepreneurship.
- Empower SMEs to withstand global shocks and strengthen domestic manufacturing.
- Encourage inter-state learning for best practices in economic governance.
- Redouble efforts to boost exports and foreign investment amidst global volatility.
Rationale
- With the decline of global cooperation, internal engines of growth become crucial.
- Deregulation can unleash innovation, enhance productivity, and ensure resilient growth.
- India's response must be strategic, systematic, and state-inclusive to capitalize on this global transition.
Economic Survey 2024–25
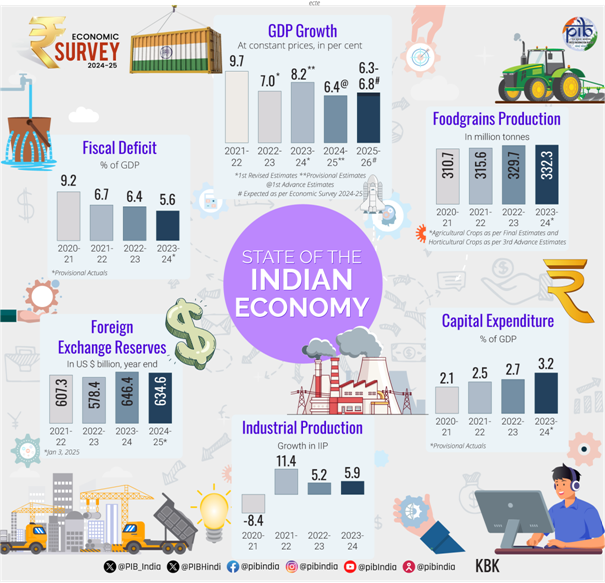
- 01 Feb 2025
In News:
- Released on 31st January 2025, a day before the Union Budget.
- Prepared by the Department of Economic Affairs, Ministry of Finance.
- Provides a comprehensive review of India’s macroeconomic trends, sectoral developments, and key policy challenges.
- Real GDP growth estimated at 6.4% in FY25 (close to decadal average); projected between 6.3–6.8% in FY26.
- Reflects India's resilience amidst global slowdown, supply chain disruptions, and geopolitical uncertainties.
Sector-wise Performance
Agriculture:
- Expected growth: 3.8% in FY25.
- Record Kharif foodgrain production: 1647.05 LMT (+5.7% YoY).
- Growth driven by horticulture, livestock, and fisheries.
- Supported by above-normal monsoons and robust reservoir levels.
Industry:
- Estimated growth: 6.2% in FY25.
- Construction, utilities, and mining contribute significantly.
- Challenges: Sluggish export demand, climate disruptions, and festival timing variations.
- Manufacturing PMI remains in the expansionary zone.
Services:
- Robust growth: 7.2% in FY25.
- Services exports up by 12.8% (April–Nov FY25) vs 5.7% in FY24.
- Growth led by finance, real estate, public administration, and professional services.
Inflation and Price Stability
- Retail inflation eased to 4.9% (Apr–Dec 2024) from 5.4% (FY24).
- Food inflation remains high at 8.4%, driven by pulses and vegetables.
- CPI expected to align with RBI's 4% target by FY26.
Investment and Infrastructure
- Capital Expenditure grew 8.2% YoY (Jul–Nov 2024); sustained increase since FY21.
- Infrastructure momentum:
- 2031 km railways commissioned (Apr–Nov 2024).
- 17 Vande Bharat trains introduced.
- Port efficiency improved; container turnaround time reduced from 48.1 to 30.4 hours.
- Renewable energy capacity rose by 15.8% YoY (Dec 2024).
External Sector and Trade
- Overall exports grew by 6% (Apr–Dec 2024); merchandise exports up 1.6%.
- Services exports surged; India now 7th largest globally.
- FDI inflows: $55.6 billion (Apr–Nov FY25), +17.9% YoY.
- Forex reserves at $640.3 billion (Dec 2024), covering 10.9 months of imports and 90% of external debt.
- CAD contained at 1.2% of GDP in Q2 FY25.
- Strong remittance inflows support BOP stability.
Fiscal Health
- Gross Tax Revenue rose 10.7% YoY (Apr–Nov 2024).
- Stable deficit indicators allowed for developmental expenditure.
- State revenue expenditure grew 12%, with subsidies increasing by 25.7%.
Banking, Credit, and Financial Markets
- Gross NPAs dropped to 2.6% (lowest in 12 years).
- CRAR of scheduled banks at 16.7% (Sept 2024), well above regulatory norms.
- Stock market cap to GDP ratio: 136%, higher than China (65%) and Brazil (37%).
- Credit-GDP gap reduced to -0.3% in Q1 FY25 (from -10.3% in Q1 FY23).
Employment and Labour Market
- Unemployment rate declined to 3.2% (2023-24) from 6.0% (2017-18).
- Labour Force Participation Rate (LFPR) and Worker-Population Ratio (WPR) improved.
- Emphasis on AI skill development to future-proof labour markets.
Health, Education & Social Sector
- Government health expenditure rose from 29% to 48% of total health spending (FY15–FY22).
- Out-of-pocket expenditure dropped from 62.6% to 39.4% in the same period.
- Education reforms aligned with NEP 2020 via programs like Samagra Shiksha, DIKSHA, PM SHRI, etc.
- Social services spending grew at 15% CAGR (FY21–FY25).
- Decline in Gini coefficient indicates improving consumption equality.
Policy Recommendations and Reform Agenda
- Deregulation as central theme to boost productivity and EoDB.
- Advocates Ease of Doing Business 2.0, led by states, targeting:
- Simplification of compliance norms.
- Risk-based regulation.
- Reduction in tariffs and licensing hurdles.
- ?50,000 crore Self-Reliant India Fund launched for MSME equity support.
- Need for long-term infrastructure investment to achieve Viksit Bharat@2047.
Global Backdrop
- Global GDP grew by 3.3% in 2023, with an average 3.2% growth projected over next five years (IMF).
- Weak global manufacturing; services sector remains stronger.
- Risks: Geopolitical tensions, trade policy fragmentation, energy transition dependence on China.
Way Forward
- Balanced outlook for FY26 with upside from:
- Strong rural demand.
- Agricultural recovery.
- Easing food inflation.
- Challenges include:
- Geopolitical tensions.
- Global trade and commodity price volatility.
- Delay in private investment materialisation.
Union Budget: understanding its formulation and implications

- 29 Jan 2025
What is the Union Budget?
The Union Budget, referred to as the Annual Financial Statement under Article 112 of the Constitution, outlines the government's estimated receipts and expenditure for a financial year. It serves as a crucial instrument for economic policy and governance.
The Budget Division of the Department of Economic Affairs under the Ministry of Finance is responsible for preparing the Union Budget.
Key Components of the Budget
1. Expenditure
Expenditure is classified on the basis of:
- Asset Creation and Liability Reduction:
- Capital Expenditure: Increases assets or reduces liabilities (e.g., infrastructure, hospitals).
- Revenue Expenditure: Does not create assets (e.g., salaries, subsidies, interest payments).
- Sectoral Impact:
- General Services: Administrative functions, defence, interest payments.
- Economic Services: Agriculture, transport, rural development, etc.
- Social Services: Education, health, welfare.
- Grants-in-Aid and Contributions.
Development Expenditure = Economic Services + Social Services, and it too can be capital or revenue in nature.
2. Receipts
Government receipts are classified into:
- Revenue Receipts: Do not create liabilities (e.g., tax and non-tax revenues).
- Non-Debt Capital Receipts: Do not involve liabilities (e.g., loan recovery, disinvestment).
- Debt-Creating Capital Receipts: Involve future liabilities (e.g., borrowings).
3. Deficit Indicators
- Fiscal Deficit = Total Expenditure - (Revenue Receipts + Non-Debt Capital Receipts)
- Primary Deficit = Fiscal Deficit - Interest Payments
- Revenue Deficit = Revenue Expenditure - Revenue Receipts
Fiscal deficit reflects the net borrowing requirement of the government.
Implications of the Budget on the Economy
1. Aggregate Demand
- Government Expenditure boosts aggregate demand.
- Tax and Non-Tax Revenue reduces disposable income, thereby contracting demand.
Policy Interpretations:
- Expansionary Fiscal Policy: Rise in expenditure-GDP ratio, increase in fiscal deficit.
- Contractionary Fiscal Policy: Increase in revenue-GDP ratio, reduction in fiscal deficit.
2. Income Distribution
- Revenue expenditure like food subsidies or MGNREGA supports lower-income groups.
- Corporate tax concessions benefit businesses. Both may increase deficits but differ in their distributional impact.
Fiscal Rules and Their Role
Fiscal rules define policy targets to maintain macroeconomic stability. They guide the government’s borrowing and spending behaviour.
Current Framework in India
India’s fiscal framework is guided by the N.K. Singh Committee Report, which recommended:
- Stock Target: Maintain a specific Debt-to-GDP ratio.
- Flow Target: Limit Fiscal Deficit-to-GDP ratio.
- Composition Target: Maintain Revenue Deficit-to-GDP ratio.
Challenges in Implementation
- India’s tax rates are largely fixed and not adjusted frequently.
- To meet fiscal targets, the government primarily adjusts expenditure.
- This rigidity may constrain the ability to undertake expansionary fiscal policy, especially during economic downturns or rising unemployment.
Need for Re-examination
Given persistent issues like low growth and unemployment, current fiscal rules may hinder responsive policy action. A flexible and context-specific fiscal framework is essential for ensuring both macroeconomic stability and inclusive development.
Conclusion
The Union Budget is not merely a financial statement but a tool of economic management. A nuanced understanding of its formulation, components, and policy implications is vital for evaluating government priorities and their impact on the economy and society.
External Commercial Borrowings (ECBs)
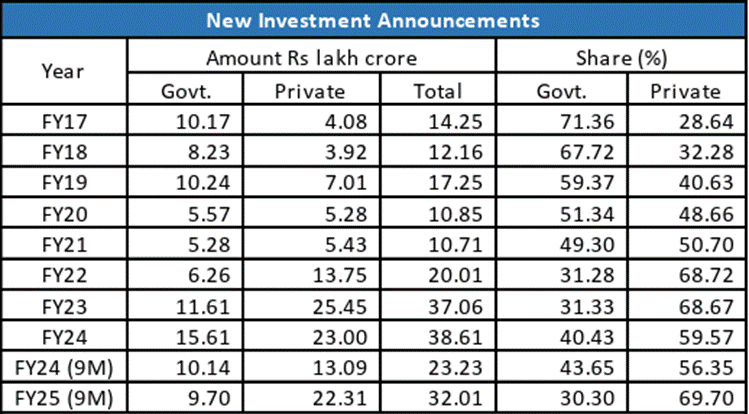
- 25 Jan 2025
In News:
A recent State Bank of India (SBI) report highlights the evolving trends in investment activity and the increasing importance of External Commercial Borrowings (ECBs) in financing India's economic growth. It also reflects rising private sector participation and a robust capital formation trend.
Investment Trends in India:
- Total Investment Announcements reached ?32.01 lakh crore during April–December 2024 (9MFY25), up 39% from the same period in FY24.
- The private sector accounted for 70% of investments in 9MFY25, up from 56% in FY24, indicating rising business confidence.
- Gross block of Indian corporates rose to ?106.5 lakh crore (March 2024), from ?73.94 lakh crore in March 2020—an addition of over ?8 lakh crore annually.
- Capital Work in Progress stood at ?13.63 lakh crore, reflecting ongoing infrastructure and industrial projects.
- Household Net Financial Savings (HNFS) improved to 5.3% of GDP in FY24 from 5.0% in FY23.
- Investment-to-GDP ratio improved, with:
- Government investment at 4.1% of GDP (FY23) — highest since FY12.
- Private corporate investment rising to 11.9% in FY23, projected to reach 12.5% in FY24.
What are External Commercial Borrowings (ECBs)?
ECBs refer to loans raised by Indian entities from foreign lenders, including commercial banks, export credit agencies, and institutional investors. These borrowings are regulated by the Reserve Bank of India (RBI) and used for purposes like capital expansion, modernization, and infrastructure development.
Current Status of ECBs (as of Sept–Nov 2024):
- Outstanding ECBs stood at $190.4 billion (Sept 2024).
- Private sector share: 63% (~$97.6 billion).
- Public sector share: 37% (~$55.5 billion).
- Of the total, non-Rupee and non-FDI ECBs accounted for $154.9 billion.
- ECBs registered (April–Nov 2024): $33.8 billion, mainly for capital goods import, local capex, and new projects.
- Cost of ECBs declined to:
- 6.6% average during April–November 2024.
- 5.8% in November 2024, down by 71 basis points from the previous month.
- Hedging practices: Private companies hedge about 74% of their ECB exposure, essential for managing currency risk.
Why Are ECBs Important for India?
- Bridging Capital Gaps: Domestic markets may not meet the capital needs of large projects.
- Lower Interest Rates: ECBs often offer cheaper financing than domestic loans.
- Infrastructure Financing: Key source of funds for sectors needing long-term investment.
- Foreign Exchange Access: Supports imports, modernization, and technology adoption.
- Private Sector Expansion: Enables firms to grow, diversify, and remain globally competitive.
Challenges and Risks:
- Currency Risk: Rupee depreciation can raise repayment costs.
- Interest Rate Risk: Linked to global rates (e.g., LIBOR/SOFR), which can rise unpredictably.
- Hedging Costs: Though necessary, hedging adds to borrowing costs.
- Global Dependency: Exposure to international financial volatility.
- Regulatory Constraints: RBI norms on end-use, maturity, and cost ceilings can reduce flexibility.
- Over-Borrowing Risk: Mismanagement can lead to unsustainable debt levels and strain forex reserves.
Clarification on ECB Liability Data:
- Some media reports mistakenly cited India’s ECB stock as $273 billion.
- The actual ECBs, as per RBI (Sept 2024), stand at $190.4 billion.
- The inflated figure includes $72 billion in FPI (Debt), which should not be classified as ECBs.
Way Forward:
- Regulatory Refinement: Simplify ECB rules for strategic sectors and long-term projects.
- Encourage Hedging: Make risk management more affordable and accessible.
- Prudent Borrowing: Promote ECBs for infrastructure, exports, and modernization rather than working capital.
- Monitoring and Oversight: Ensure transparency and prevent over-leverage.
- Strengthen Domestic Financing: To reduce overdependence on foreign borrowing.
India’s Renewable Energy Revolution
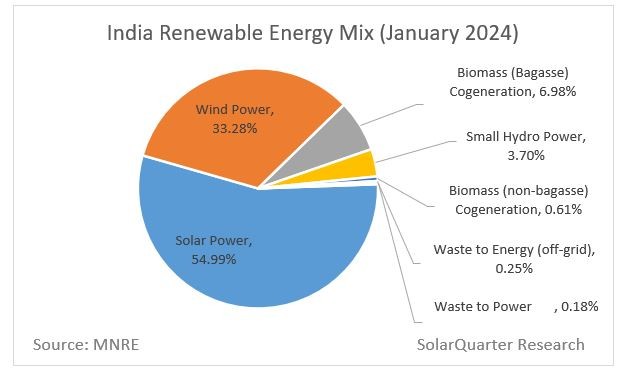
- 22 Jan 2025
Introduction
India's transition towards clean energy has accelerated, with 2024 witnessing record-breaking renewable energy (RE) installations and policy innovation. With a vision to achieve 500 GW of non-fossil fuel capacity by 2030 and net-zero emissions by 2070, India is shaping itself as a global leader in sustainable development.
What is Renewable Energy?
Renewable energy is derived from naturally replenishing sources like solar, wind, hydropower, and biomass. It plays a vital role in:
- Reducing dependence on fossil fuels.
- Lowering greenhouse gas emissions.
- Ensuring long-term energy security.
India’s RE Targets and Progress
Parameter Target/Status
2030 Target 500 GW of non-fossil fuel capacity
Net Zero by 2070
Current Status (Jan 2025) 217.62 GW of non-fossil fuel-based capacity
Short-term Goal 50% energy capacity from renewable sources
2024: Year of Renewable Milestones
Solar Energy
- 24.5 GW added in 2024 — a 2.8x increase over 2023.
- 18.5 GW utility-scale solar: Rajasthan, Gujarat, Tamil Nadu contributed 71%.
- Rooftop Solar:
- 4.59 GW added (↑53%)
- 7 lakh installations under PM Surya Ghar: Muft Bijli Yojana.
- Off-grid Solar:
- 1.48 GW added (↑182%), promoting rural energy access.
Wind Energy
- 3.4 GW added: Gujarat (1,250 MW), Karnataka (1,135 MW), Tamil Nadu (980 MW) = 98% of new capacity.
Hydropower & Others
- Existing hydropower plants modernized to improve efficiency.
Government Initiatives Driving Growth
Scheme/Initiative Purpose
PM Surya Ghar: Muft Bijli Yojana Rooftop solar subsidies for households
Green Energy Corridor (GEC) Transmission infra for RE-rich states
Hydrogen Energy Mission Promote green hydrogen production
National Smart Grid Mission (NSGM) Integration of variable RE sources into the grid
FAME Scheme Promote EV adoption, indirectly supporting RE usage
International Solar Alliance (ISA) Strengthen global cooperation in solar energy
Challenges in RE Expansion
- Land Acquisition: Resistance from locals, especially in solar park areas.
- Grid Stability: Intermittency of solar/wind leads to voltage and frequency issues.
- Storage Gaps: Lack of large-scale battery storage limits surplus utilization.
- E-Waste Concerns: Rising disposal of solar panels and batteries.
- Mineral Dependency: Import reliance on lithium, cobalt, etc.
- Regulatory Bottlenecks: Delay in approvals and lack of inter-state coordination.
Way Forward: Strategic Interventions
Technological Innovation
- Floating Solar Projects: Utilize reservoirs to save land and reduce evaporation.
- Decentralized Systems: Peer-to-peer trading via blockchain for energy democratization.
- Green Hydrogen: Use surplus RE for hydrogen fuel, develop hydrogen corridors.
Infrastructure & Manufacturing
- Renewable Energy SEZs: Promote local manufacturing and innovation.
- Smart Grid Development: Improve grid flexibility and real-time balancing.
Environmental Management
- Circular Economy for RE Waste: Design policies for solar panel and battery recycling.
- Urban Integration: Incentivize rooftop installations in urban centers.
Conclusion
India’s renewable energy revolution is at a crucial juncture. With 2024 setting a strong precedent through record installations and policy progress, the path to 2030 and beyond will require addressing infrastructural, financial, and regulatory challenges. A multi-pronged, inclusive, and technology-driven approach will help India lead the global clean energy transition.
Why Farmers Deserve Price Security
- 11 Jan 2025
Introduction:
The future of Indian agriculture is at a crossroads. With the shrinking of the agricultural workforce and the diversion of fertile farmlands for urbanization, ensuring the sustainability of farming is a strategic imperative. Among the various support mechanisms for farmers, the Minimum Support Price (MSP) remains a central point of debate. Should there be a legal guarantee for MSP? This question has gained prominence, especially with the rising challenges in agriculture, from unpredictable climate patterns to volatile market prices.
The Decline of Agriculture and Its Impact
India’s agricultural sector faces a dual crisis: loss of both land and human resources. Prime agricultural lands across river basins, such as the Ganga-Yamuna Doab or the Krishna-Godavari delta, are being repurposed for real estate, infrastructure, and industrial projects. Additionally, the number of "serious farmers" – those deriving at least half of their income from agriculture – is dwindling. The number of operational holdings may be 146.5 million, but only a small fraction of these farmers remains committed to agriculture.
This decline threatens the future of India’s food security, as the country will need to feed a population of 1.7 billion by the 2060s. To sustain farming and ensure long-term food security, we must secure farmers' livelihoods. Price security, particularly through MSP, plays a crucial role in this context.
The Role of MSP in Securing Farmers
MSP is the government-mandated price at which it guarantees the purchase of crops if market prices fall below a certain threshold. It provides a safety net for farmers against price volatility. The process of fixing MSP involves recommendations by the Commission for Agricultural Costs and Prices (CACP), which takes into account factors such as the cost of production and market trends. Once approved by the Cabinet Committee on Economic Affairs (CCEA), MSP is set for various crops, including rice, wheat, and sugarcane.
For farmers to stay in business, there must be a balance between production costs and returns. Farming is a risky business – yield losses can occur due to weather anomalies, pest attacks, or other natural factors. However, price risks can be mitigated with a guaranteed MSP. This would encourage farmers to invest in their land and adopt modern farming technologies, which would boost productivity and reduce costs.
Arguments for and Against Legal MSP Guarantee
Supporters of a legal MSP guarantee argue that it would provide financial security to farmers, protecting them from unpredictable market conditions. It would also promote crop diversification, encourage farmers to shift from water-intensive crops to those less dependent on irrigation, and inject resources into rural economies, thus addressing distress in rural areas.
However, critics highlight several challenges with a legal guarantee for MSP. The most significant concern is the fiscal burden it would impose on the government, potentially reaching Rs. 5 trillion. Furthermore, such a system could distort market dynamics, discouraging private traders and leading to a situation where the government becomes the primary buyer of agricultural produce. This could be economically unsustainable, especially for crops with low yields. Additionally, legal MSP guarantees could violate World Trade Organization (WTO) subsidy principles, adversely impacting India’s agricultural exports.
The Way Forward: A Balanced Approach
Given the challenges associated with a legal MSP guarantee, alternative measures should be explored. Price Deficiency Payment (PDP) schemes, such as those implemented in Madhya Pradesh and Haryana, could be expanded at the national level. These schemes compensate farmers for the difference between market prices and MSP, ensuring price security without the fiscal burden of procurement.
Additionally, the government can focus on improving agricultural infrastructure, such as cold storage facilities, to help farmers better access markets and increase price realization. Supporting Farmer Producer Organizations (FPOs) could also help farmers by enhancing collective bargaining power and ensuring better prices for their produce. Moreover, gradual expansion of MSP coverage to include a wider range of crops would encourage diversification, reducing the dominance of rice and wheat.
Government Extends Special Subsidy on DAP

- 03 Jan 2025
In News:
The Indian government has decided to extend the special subsidy on Di-Ammonium Phosphate (DAP) fertilizer for another year, a decision aimed at stabilizing farmgate prices and addressing the challenges posed by the depreciation of the Indian rupee.
Key Government Decision
- Extension of Subsidy: The Centre has extended the Rs 3,500 per tonne special subsidy on DAP from January 1, 2025 to December 31, 2025.
- Objective: This extension aims to contain farmgate price surges of DAP, India’s second most-consumed fertilizer, which is being impacted by the fall in the rupee's value against the US dollar.
Fertilizer Price Dynamics and Impact
- MRP Caps on Fertilizers: Despite the decontrol of non-urea fertilizers, the government has frozen the maximum retail price (MRP) for these products.
- Current MRPs:
- DAP: Rs 1,350 per 50-kg bag
- Complex fertilizers: Rs 1,300 to Rs 1,600 per 50-kg bag depending on composition.
- Current MRPs:
- Subsidy on DAP: The subsidy includes Rs 21,911 per tonne on DAP, plus the Rs 3,500 one-time special package.
- Impact of Currency Depreciation:
- The rupee's depreciation has made imported fertilizers significantly more expensive.
- The landed price of DAP has increased from Rs 52,960 per tonne to Rs 54,160 due to the rupee falling from Rs 83.8 to Rs 85.7 against the dollar.
- Including additional costs (customs, port handling, insurance, etc.), the total cost of imported DAP is now Rs 65,000 per tonne, making imports unviable without further subsidy or MRP adjustments.
- The rupee's depreciation has made imported fertilizers significantly more expensive.
Industry Concerns and Viability Issues
- Import Viability:
- Fertilizer companies face significant cost pressures due to rising import prices and the current MRP caps.
- Without an increase in government subsidies or approval to revise MRPs upwards, imports will be unviable.
- Even with the extended subsidy, companies estimate a Rs 1,500 per tonne shortfall due to currency depreciation.
- Stock Levels and Supply Challenges:
- Current stock levels for DAP (9.2 lakh tonnes) and complex fertilizers (23.7 lakh tonnes) are below last year's levels.
- With inadequate imports, there are concerns about fertilizer supply for the upcoming kharif season (June-July 2025).
Government’s Strategy and Fiscal Implications
- Compensation for Imports:
- In September 2024, the government approved compensation for DAP imports above a benchmark price of $559.71 per tonne, based on an exchange rate of Rs 83.23 to the dollar.
- With the rupee falling below Rs 85.7, these previous compensation calculations have become outdated.
- Fiscal Impact:
- The extended subsidy will cost the government an additional Rs 6,475 crore. Despite this, political implications of raising the MRP are minimal, as only non-major agricultural states are facing elections in 2025.
Future Outlook and Priorities
- Immediate Priority: The government’s primary concern is securing adequate fertilizer stocks for the kharif season, focusing on ensuring sufficient imports of both finished fertilizers and raw materials.
- Balancing Factors: The government will need to navigate the complex balance of maintaining fertilizer affordability for farmers, ensuring the viability of fertilizer companies, and managing fiscal constraints.
As the subsidy extension is implemented, all eyes will be on the government's ability to ensure a stable supply of fertilizers while safeguarding both farmer interests and economic sustainability in the face of an increasingly challenging exchange rate environment.
Introduction to Dr. Manmohan Singh's Economic Reforms

- 31 Dec 2024
In News:
Dr. Manmohan Singh, a distinguished economist, played a crucial role in shaping India’s economic trajectory. His leadership, as Finance Minister (1991–96) and Prime Minister (2004–14), is particularly noted for the economic liberalization and reform policies that transformed India’s economy.
India’s Economic Crisis of 1991
- Economic Collapse: India faced a severe balance of payments crisis, with dwindling foreign reserves and rising inflation.
- Key Challenges: Fiscal deficit, industrial stagnation, and trade imbalances worsened by the collapse of the Soviet Union.
- Urgent Measures: Dr. Singh was appointed Finance Minister during this crisis and initiated bold reforms to stabilize and grow the economy.
Key Reforms in 1991
- Devaluation of the Rupee
- Aimed at making Indian exports competitive in global markets.
- Reduced import tariffs and liberalized foreign trade.
- Industrial Policy Reforms
- Abolition of Licence Raj: Deregulated the industrial sector, promoting private enterprises.
- Reduced state control and encouraged foreign investment, leading to industrial growth.
- Banking and Financial Reforms
- Reduced the statutory liquidity ratio (SLR) and cash reserve ratio (CRR).
- Allowed for more credit flow, fostering economic expansion and banking sector efficiency.
- Global Integration
- Introduced economic liberalization policies, integrating India with the global economy and attracting foreign investments.
Economic Growth and Social Welfare Initiatives
- Poverty Reduction: Reforms helped lift millions out of poverty by fostering job creation and industrial growth.
- Mahatma Gandhi National Rural Employment Guarantee Act (MGNREGA): Launched in 2005, providing 100 days of wage employment to rural households.
- Right to Information (RTI) and Right to Education (RTE)
- Empowered citizens by ensuring transparency and access to government information.
- RTE guaranteed free and compulsory education for children aged 6-14.
- Financial Inclusion: Aadhar project introduced to facilitate welfare delivery and financial inclusion.
Legacy of Economic Liberalization and Growth
- Economic Growth: Under his leadership, India’s GDP grew at an average rate of 8%, establishing India as one of the fastest-growing economies.
- Shift to a Market-Driven Economy: Reforms dismantled socialist controls, facilitating the rise of the private sector.
- Attracting Foreign Investment: Economic liberalization and policy reforms made India an attractive destination for foreign capital.
Leadership During Political and Economic Challenges
- Reluctant Prime Minister
- In 2004, Singh became Prime Minister despite initial reluctance, emerging as a unifying figure during coalition politics.
- His tenure saw India’s rise as a global economic power, particularly from 2004–2009.
- Challenges
- Singh’s second term was marred by allegations of corruption and policy paralysis, leading to criticism of his administration.
- However, his personal integrity remained intact, and he maintained focus on governance.
- Historic India-US Nuclear Deal (2008)
- The deal marked a significant shift in India’s foreign relations and energy policies, enabling civilian nuclear trade.
Conclusion
Dr. Manmohan Singh’s economic policies are central to India's modern economic framework. His vision transformed India from a closed, socialist economy to a vibrant, globalized economy, promoting inclusive growth and institutional reforms. Despite facing challenges and criticisms, his legacy remains a testament to strategic policymaking that continues to influence India’s economic landscape.
Analysis of Female Labour Force Participation Rate (LFPR) Trends in India: 2017-2023
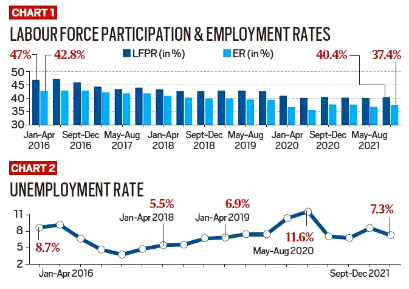
- 11 Dec 2024
In News:
The Economic Advisory Council to the Prime Minister (EAC-PM) recently released a working paper revealing critical insights into the trends of female Labour Force Participation Rate (LFPR) in India from 2017-18 to 2022-23. The report highlights an overall increase in female LFPR, with rural areas experiencing more significant growth compared to urban areas. This article delves into the key findings, regional disparities, influencing factors, and government initiatives aimed at promoting female workforce participation.
Key Findings on Female LFPR
The period between 2017-18 and 2022-23 witnessed a notable rise in female LFPR, both in rural and urban regions, though rural areas saw higher gains.
Rural female LFPR surged by approximately 69%, from 24.6% to 41.5%, while urban female LFPR increased from 20.4% to 25.4%. This consistent growth was observed even after excluding unpaid family workers or household helpers, reinforcing the long-term trend of increased female workforce participation across India.
However, a significant point of discussion in the report was the regional variations in female LFPR. States like Bihar, Punjab, and Haryana have consistently reported low female LFPR, which is noteworthy considering that Punjab and Haryana are among India's wealthiest states, while Bihar is the poorest. This regional disparity suggests that economic prosperity does not automatically translate into higher female labour force participation, highlighting deeper socio-cultural and structural barriers.
Regional Disparities in Female LFPR
The report emphasizes the persistent challenges in northern and eastern India. Punjab and Haryana, despite their affluence, have struggled with low female LFPR. Cultural and societal norms in these regions may contribute to the underrepresentation of women in the workforce, particularly in rural areas where traditional gender roles are more entrenched.
On the other hand, Bihar, the poorest state in India, had the lowest female LFPR in the country, particularly in rural areas. However, there has been a significant improvement in recent years, especially among rural married women. This indicates a slow but positive shift in attitudes towards female employment in these states.
In contrast, northeastern states such as Nagaland and Arunachal Pradesh have shown significant improvements in female LFPR, particularly in rural areas. These states have demonstrated that regional and cultural factors can also create conducive environments for female workforce participation.
Demographic Factors Affecting Female LFPR
Several demographic patterns influence female LFPR, including marital status and age. The report notes that married men consistently exhibit higher LFPR compared to women. Marriage, however, has a detrimental impact on female LFPR, particularly in urban areas, where women often face greater familial and societal pressures to prioritize domestic responsibilities over formal employment.
Age dynamics also play a crucial role in female LFPR trends. The data reveals a bell-shaped curve for female participation, peaking around the age of 30-40 years and sharply declining thereafter. This is in stark contrast to male LFPR, which remains almost universally high between the ages of 30-50 before gradually declining. These trends underscore the challenges women face in sustaining their participation in the workforce due to familial responsibilities, especially after marriage and childbirth.
Government Initiatives and the Rise in Female LFPR
The government's focus on women-led development is evident through various schemes aimed at increasing female workforce participation. Programs like Mudra Loans, the Drone Didi Scheme, and the Deendayal Antyodaya Yojana have been particularly instrumental in empowering women, especially in rural areas. These initiatives provide women with access to financial resources, skill development opportunities, and avenues for entrepreneurship, all of which contribute to the rise in female LFPR.
The EAC-PM's analysis acknowledges the positive impact of these government schemes, but it also stresses the need for further research to evaluate their long-term effectiveness. While the descriptive analysis highlights a substantial increase in female LFPR between 2017-18 and 2022-23, especially in rural areas, there remains a need for continuous monitoring and assessment of these schemes to ensure their sustained impact.
Conclusion: A Positive Shift, but Challenges Remain
The increase in female LFPR across India from 2017-18 to 2022-23 signals a positive shift in employment trends, particularly in rural areas. However, regional disparities, societal norms, and demographic factors continue to pose challenges. The rise in female LFPR is encouraging, but it is essential to understand the deeper socio-economic factors that shape women's participation in the workforce.
Government schemes have contributed to this growth, but future research is necessary to gauge their long-term effects and ensure that women’s participation in the workforce is not just a short-term trend. It is crucial that the government continues to refine policies that support women in overcoming socio-cultural and economic barriers, especially in less prosperous states like Bihar, Punjab, and Haryana. Sustained efforts, including education, skill development, and gender-sensitive policies, will be key to ensuring that the rise in female LFPR is both inclusive and long-lasting.
The analysis by the EAC-PM provides an essential framework for policymakers to design more targeted interventions to address regional disparities and create a more inclusive labor market for women in India.
Building on the Revival of the Manufacturing Sector

- 07 Dec 2024
In News:
India’s manufacturing sector has shown remarkable signs of recovery and growth, thanks to strategic policy initiatives like the Production Linked Incentive (PLI) scheme. To fully capitalize on this momentum and become a global manufacturing hub, however, deeper reforms are needed.
The Success of the PLI Scheme: A Catalyst for Growth
The government’s PLI scheme has been instrumental in revitalizing key sectors like electronics, pharmaceuticals, automobiles, and textiles. It has not only boosted production but also increased exports and job creation. According to the Annual Survey of Industries (ASI) 2022-23, manufacturing output grew by an impressive 21.5%, while gross value added (GVA) increased by 7.3%. Sectors such as basic metals, refined petroleum products, food products, and motor vehicles, which are beneficiaries of the PLI scheme, contributed 58% of total manufacturing output, registering growth of 24.5%.
This success underlines the potential of India’s manufacturing sector, with the PLI scheme acting as a key enabler. However, while the recovery is promising, there are significant challenges to overcome to sustain long-term growth.
Expanding PLI Incentives to New Sectors
The PLI scheme has largely benefitted traditional industries like electronics and automotive manufacturing. To further accelerate growth, the scope of the scheme must be extended to labour-intensive sectors such as apparel, footwear, and furniture, which hold immense potential for job creation. Additionally, emerging sectors like aerospace, space technology, and maintenance, repair, and overhaul (MRO) services offer new avenues for growth. By diversifying the incentive structure to these sectors, India could establish a more robust and resilient manufacturing ecosystem.
In sectors like capital goods, where India is heavily import-dependent, the potential for reducing supply chain vulnerabilities is significant. Moreover, promoting green manufacturing and advanced technologies could further bolster India’s competitiveness in global markets.
Addressing the Divergence Between Output and Value Addition
Despite a surge in production, India’s gross value added (GVA) has not kept pace with output growth. The ASI data shows that input prices soared by 24.4% in 2022-23, indicating that while production volumes are up, industries are grappling with high input costs. A more streamlined import regime could mitigate these costs. Simplifying tariffs into a three-tier system (for raw materials, intermediates, and finished goods) would reduce input costs, enhance competitiveness, and improve integration into global value chains.
Regional Imbalance: A Barrier to Inclusive Growth
The manufacturing sector’s growth is heavily concentrated in a few states such as Maharashtra, Gujarat, Tamil Nadu, Karnataka, and Uttar Pradesh, which account for over 54% of manufacturing GVA. This concentration not only restricts equitable development but also hampers the overall growth potential of the sector. To address this, it is crucial that states actively participate in India's manufacturing growth story by implementing market reforms in land, labour, and power. Additionally, infrastructure development and investment promotion in less industrialized regions could help balance growth and ensure that the benefits of manufacturing reach all corners of the country.
Fostering MSME Growth and Enhancing Female Workforce Participation
Micro, small, and medium enterprises (MSMEs) contribute about 45% of India’s manufacturing GDP and employ around 60 million people. To scale these businesses and integrate them into global value chains, PLIs should be tailored to accommodate their needs, such as lowering capital investment thresholds and reducing production targets.
Equally important is the enhancement of female workforce participation. Studies suggest that India’s manufacturing output could increase by 9% if more women enter the workforce. The development of supportive infrastructure, such as hostels and childcare facilities, can play a pivotal role in enabling women’s participation, thus driving inclusive growth.
Conclusion: The Path Forward
To transform into a developed economy by 2047, India must continue to focus on strengthening its manufacturing sector. According to industry estimates, manufacturing’s share in Gross Value Added (GVA) can rise from 17% to 25% by 2030 and further to 27% by 2047. Achieving this will require sustained efforts to enhance competitiveness through business reforms, cost reduction, and policy support. India is well-positioned to harness its manufacturing potential, but timely and focused interventions are necessary to turn this vision into reality.
Scrapping of Windfall Gains Tax
- 05 Dec 2024
Introduction
On December 2, 2024, the Indian government withdrew the windfall gains tax on domestic crude oil production and fuel exports (diesel, petrol, and aviation turbine fuel - ATF). This tax, initially imposed in July 2022, was introduced in response to the surge in global oil prices following Russia's invasion of Ukraine. Its removal reflects the current global oil market stability and the improved fuel supply situation in India.
What is Windfall Gains Tax?
Definition
A windfall tax is a levy imposed on unexpected profits that result from extraordinary events, such as geopolitical crises or market disruptions. In the case of India, the tax was applied to the super-normal profits of oil producers and fuel exporters due to the global energy turmoil.
Key Features
- Domestic Crude Oil: The Special Additional Excise Duty (SAED) was imposed on domestic crude oil production.
- Fuel Exports: A combination of SAED and Road and Infrastructure Cess (RIC) was levied on diesel, petrol, and ATF exports.
Rationale Behind the Windfall Gains Tax
Immediate Context
The tax was introduced during a period of soaring global crude oil prices, driven by the Russia-Ukraine conflict. India, which imports over 85% of its oil, faced concerns about the availability of fuels and the impact of rising prices on domestic consumption. The tax was seen as a way to:
- Ensure Domestic Fuel Supply: By discouraging excessive fuel exports during a period of global supply chain disruptions.
- Increase Government Revenue: The tax aimed to capture windfall profits and offset the duty cuts on domestic fuel sales.
Global Context
Other countries also implemented similar windfall taxes during this period, as energy companies saw record profits due to the price surge.
Decline in Windfall Gains Tax Revenue
Revenue Collection
The windfall gains tax initially raised significant revenue, but the amount has decreased over time due to falling global oil prices:
- FY 2022-23: Rs 25,000 crore
- FY 2023-24: Rs 13,000 crore
- FY 2024-25 (so far): Rs 6,000 crore
This decline, combined with reduced oil prices, led to the tax being effectively inactive before its formal withdrawal.
Withdrawal of the Windfall Gains Tax
Reasons for the Withdrawal
- Global Stabilization: Crude oil prices, which had exceeded $100 per barrel, have now stabilized under $75 per barrel, with no immediate signs of a significant price surge.
- Domestic Fuel Availability: There is now a robust fuel supply in the domestic market, making the tax less necessary.
- Declining Revenues: With the tax generating diminishing returns, it was no longer economically viable for the government to maintain it.
Impact of the Scrapping
The government's move to scrap the windfall gains tax is seen as a signal of stability and predictability in the taxation regime. It assures the oil industry that the government is confident in the stability of global oil prices and supply chains.
Criticism of the Windfall Tax
Industry Opposition
The windfall tax faced opposition from the oil industry, which argued that it:
- Reduced Profitability: The tax limited the profits of publicly listed companies like ONGC and Reliance Industries.
- Discouraged Oil Production: By making the taxation environment unpredictable, it deterred investment in oil exploration and production in a country that is heavily dependent on oil imports.
- Created Uncertainty: Frequent revisions of the tax led to an unstable business environment.
Conclusion
The scrapping of the windfall gains tax is a significant policy shift. It not only provides relief to oil companies but also signals a more predictable and stable taxation regime. By withdrawing the tax, the government is fostering a conducive environment for future investments in domestic oil production and signaling its confidence in the stability of global oil prices. This move is a crucial step in ensuring that India’s energy policies remain adaptable and aligned with the evolving global market conditions.
India's Gig Economy: Growth and Impact on Employment

- 03 Dec 2024
Introduction
India’s gig economy is experiencing rapid growth, with projections indicating it will significantly contribute to the national economy and employment generation. A recent report by the Forum for Progressive Gig Workers estimates the gig economy could reach $455 billion by the end of 2024, growing at a 17% compounded annual growth rate (CAGR). By 2030, it may add 1.25% to India’s GDP and create 90 million jobs.
What is the Gig Economy?
- Definition: The gig economy refers to a labor market based on short-term, flexible jobs, typically facilitated by digital platforms. Gig workers, also called freelancers or independent contractors, are compensated for each task they complete.
- Key Features:
- Flexibility in work schedule and location.
- Task-based employment through digital platforms.
- Common sectors: e-commerce, transportation, delivery services, and freelance work.
Status of the Gig Economy in India
- Market Growth:
- In 2020-21, India had 7.7 million gig workers, which is expected to grow to 23.5 million by 2029-30.
- Key sectors contributing to growth include e-commerce, transportation, and delivery services.
- Driving Factors:
- Digital Penetration: With over 936 million internet subscribers and 650 million smartphone users, digital infrastructure is a key enabler of the gig economy.
- Startup and E-commerce Growth: The rise of startups and e-commerce platforms has increased demand for flexible labor.
- Changing Work Preferences: Younger generations seek work-life balance, opting for flexible gig work.
Gig Economy and Employment Generation
- Contribution to GDP: The gig economy is expected to contribute 1.25% to India’s GDP by 2030.
- Job Creation:
- The gig economy could create up to 90 million jobs by 2030.
- It is estimated that by 2030, gig workers will comprise 4.1% of India’s total workforce.
- Benefits:
- Women’s Empowerment: Gig work provides financial independence and flexibility, especially benefiting women in the workforce.
- Regional Growth: Tier-II and Tier-III cities are seeing accelerated growth in gig work opportunities.
Challenges Faced by Gig Workers
- Job Insecurity: Many gig workers experience instability in their employment, especially in low-skilled jobs.
- Income Volatility: Earnings are unpredictable, and workers face difficulty in financial planning.
- Regulatory Gaps: There is no comprehensive legal framework to protect gig workers’ rights and ensure fair working conditions.
- Delayed Payments: A significant number of workers face delayed payments, affecting their financial well-being.
- Skill Development: Many workers report a lack of opportunities for career advancement and skill development.
Government Initiatives for Gig Workers
- Code on Social Security, 2020: Recognizes gig workers and aims to extend social security benefits, though it lacks comprehensive coverage.
- e-Shram Portal & Welfare Schemes: Initiatives like Pradhan Mantri Shram Yogi Maandhan Yojana and PMJJBY aim to provide financial security to gig workers.
- State-level Initiatives:
- Rajasthan’s Platform-Based Gig Workers Act (2023) focuses on registration and welfare.
- Karnataka’s bill mandates formal registration and grievance mechanisms.
The Way Forward
- Legal Reforms: India can draw from international models like California and the Netherlands, where gig workers are reclassified as employees to ensure protections such as minimum wages and regulated working hours.
- Portable Benefits System: Implementing a system where gig workers can access benefits like healthcare and retirement plans regardless of their employer.
- Skill Development: Strengthening collaborations with vocational institutions to enhance skills and improve earning potential.
- Technological Solutions: Establishing robust feedback mechanisms for workers to report exploitation and ensure fairness within the gig economy.
Conclusion
The gig economy in India is poised to become a significant driver of economic growth and job creation. However, addressing challenges such as income volatility, job insecurity, and regulatory gaps is crucial to ensuring sustainable growth.
National Mission on Natural Farming (NMNF)
- 29 Nov 2024
In News:
The Union Cabinet recently approved the launch of the National Mission on Natural Farming (NMNF), marking a significant shift in the government's approach to agriculture. This initiative, a standalone Centrally Sponsored Scheme under the Ministry of Agriculture & Farmers' Welfare, aims to promote natural farming across India, focusing on reducing dependence on chemical fertilizers and promoting environmentally sustainable practices.
What is Natural Farming?
Natural farming, as defined by the Ministry of Agriculture, is a chemical-free agricultural method that relies on inputs derived from livestock and plant resources. The goal is to encourage farmers to adopt practices that rejuvenate soil health, improve water use efficiency, and enhance biodiversity, while reducing the harmful effects of fertilizers and pesticides on human health and the environment. The NMNF will initially target regions with high fertilizer consumption, focusing on areas where the need for sustainable farming practices is most urgent.
Evolution of Natural Farming Initiatives
The NMNF is not an entirely new concept but a scaled-up version of the Bhartiya Prakritik Krishi Paddhti (BPKP) introduced during the NDA government's second term (2019-24). The BPKP was part of the larger Paramparagat Krishi Vikas Yojna (PKVY) umbrella scheme, and natural farming was also promoted along the Ganga River under the NamamiGange initiative in 2022-23. With the renewed focus on natural farming following the 2024 elections, the government aims to extend the lessons learned from BPKP into a comprehensive mission mode, setting a clear direction for sustainable agriculture.
In Budget speech for 2024-25, it was announced a plan to initiate one crore farmers into natural farming over the next two years. The mission will be implemented through scientific institutions and willing gram panchayats, with the establishment of 10,000 bio-input resource centers (BRCs) to ensure easy access to the necessary inputs for natural farming.
Key Objectives
The NMNF aims to bring about a paradigm shift in agricultural practices by:
- Expanding Coverage: The mission plans to bring an additional 7.5 lakh hectares of land under natural farming within the next two years. This will be achieved through the establishment of 15,000 clusters in gram panchayats, benefiting 1 crore farmers.
- Training and Awareness: The mission will establish around 2,000 model demonstration farms at Krishi Vigyan Kendras (KVKs), Agricultural Universities (AUs), and farmers' fields. These farms will serve as hubs for training farmers in natural farming techniques and input preparation, such as Jeevamrit and Beejamrit, using locally available resources.
- Incentivizing Local Inputs: The creation of 10,000 bio-input resource centers will provide farmers with easy access to bio-fertilizers and other natural farming inputs. The mission emphasizes the use of locally sourced inputs to reduce costs and improve the sustainability of farming practices.
- Farmer Empowerment: 30,000 Krishi Sakhis (community resource persons) will be deployed to assist in mobilizing and guiding farmers. These trained individuals will play a key role in generating awareness and providing on-ground support to the farmers practicing natural farming.
- Certifications and Branding: A major aspect of the mission is to establish scientific standards for natural farming produce, along with a national certification system. This will help in creating a market for organically grown produce and encourage more farmers to adopt sustainable practices.
Targeting High Fertilizer Consumption Areas
The Ministry of Agriculture has identified 228 districts in 16 states, including Uttar Pradesh, Punjab, Maharashtra, and West Bengal, where fertilizer consumption is above the national average. These districts will be prioritized for the NMNF rollout, as they have high fertilizer usage but low adoption of natural farming practices. By focusing on these areas, the mission seeks to reduce the over-dependence on chemical fertilizers and foster a transition to more sustainable farming practices.
Benefits of Natural Farming
The NMNF aims to deliver multiple benefits to farmers and the environment:
- Cost Reduction: Natural farming practices can significantly reduce input costs by decreasing the need for costly chemical fertilizers and pesticides.
- Soil Health and Fertility: By rejuvenating the soil through organic inputs, natural farming improves soil structure, fertility, and microbial activity, leading to long-term agricultural sustainability.
- Climate Resilience: Natural farming enhances resilience to climate-induced challenges such as drought, floods, and waterlogging.
- Healthier Produce: Reduced use of chemicals results in safer, healthier food, benefitting both farmers and consumers.
- Environmental Conservation: The promotion of biodiversity, water conservation, and carbon sequestration in soil leads to a healthier environment for future generations.
Conclusion
The launch of the National Mission on Natural Farming represents a critical step toward transforming India's agricultural practices into a more sustainable and environmentally friendly model. By targeting regions with high fertilizer usage, providing farmers with the tools and knowledge for natural farming, and creating a system for certification and branding, the government hopes to make natural farming a mainstream practice. As India continues to grapple with the challenges of climate change, soil degradation, and health risks from chemical inputs, the NMNF provides a promising framework for sustainable agriculture that benefits farmers, consumers, and the environment alike.
India’s Urban Infrastructure
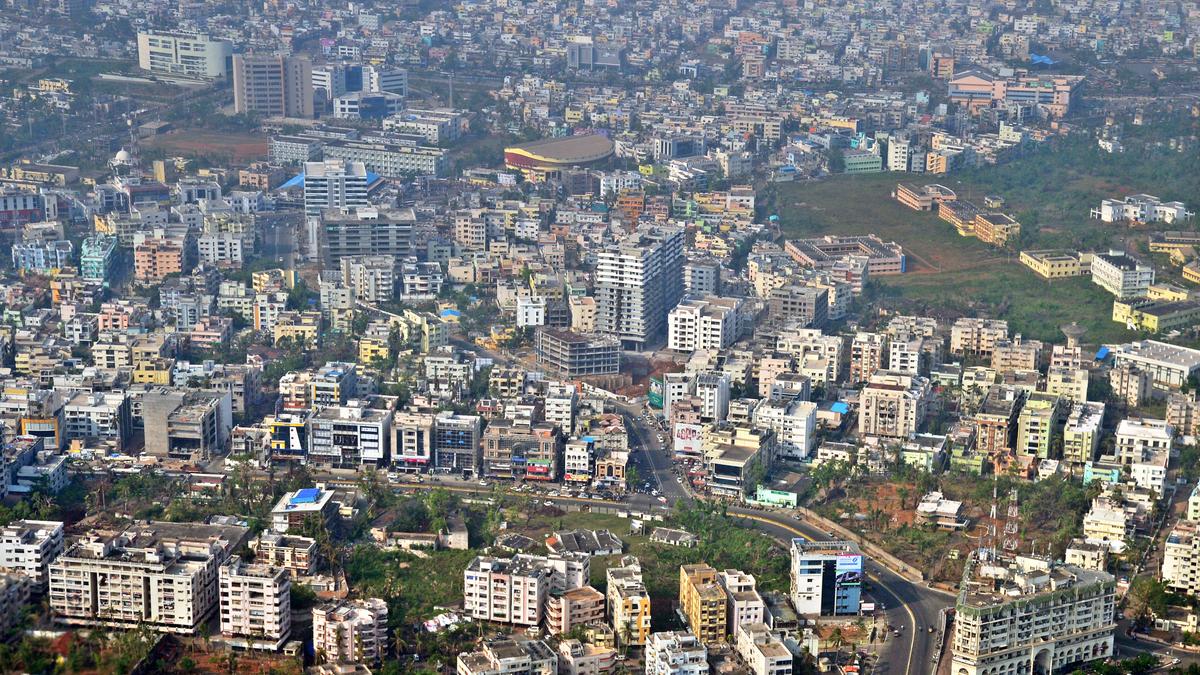
- 28 Nov 2024
Introduction
India’s urban population is projected to double from 400 million to 800 million by 2050. This demographic shift presents both challenges and opportunities for transforming the country’s urban infrastructure. To meet the growing needs of urban areas, India will require an investment of approximately ?70 lakh crore by 2036, a figure significantly higher than current spending levels.
Financial Challenges in Urban Infrastructure
- Investment Gap
- The current annual investment in urban infrastructure stands at ?1.3 lakh crore, which is only 28% of the ?4.6 lakh crore needed annually.
- A large portion of the existing investment, around 50%, is directed towards basic urban services, with the remainder allocated to urban transport.
- Municipal Finances
- Municipal finances have remained stagnant at 1% of GDP since 2002.
- Despite increased transfers from the central and state governments, municipal bodies face financial strain.
- The contribution of municipal own-revenue has decreased from 51% to 43%, indicating a reduced financial independence.
- Revenue Collection Inefficiencies
- Urban local bodies (ULBs) are collecting only a small fraction of their potential revenues, with property tax collections representing just 0.15% of GDP.
- Cost recovery for essential services like water supply and waste management ranges between 20% and 50%, pointing to a significant funding gap.
- Underutilization of Resources
- Cities like Hyderabad and Chennai utilized only 50% of their capital expenditure budgets in 2018-19.
- Central schemes such as AMRUT and the Smart Cities Mission also showed suboptimal fund utilization, with utilization rates of 80% and 70%, respectively.
- Decline in Public-Private Partnerships (PPPs)
- Investments through PPPs in urban infrastructure have seen a sharp decline, from ?8,353 crore in 2012 to ?467 crore in 2018.
- This drop is attributed to limited project-specific revenues and inadequate funding mechanisms.
Structural and Administrative Challenges
- Weak Governance and Fragmented Management
- Fragmented governance and limited administrative autonomy hinder effective urban planning and resource allocation.
- Municipal bodies often lack the ability to undertake long-term planning and project execution due to these governance challenges.
- Climate Vulnerability and Sustainability: Urban areas are increasingly vulnerable to climate risks like floods and heatwaves. However, many urban infrastructure projects fail to incorporate climate resilience in their planning, exacerbating the long-term vulnerability of investments.
- Inadequate Land Management
- There is poor coordination between land use planning and infrastructure development, resulting in urban sprawl and inefficient transportation systems.
- Opportunities to capitalize on the land value generated by metro and rail projects remain underutilized.
Measures for Transforming Urban Infrastructure
- Streamline Revenue Collection: Leverage technology to improve property tax collection systems and enhance cost recovery in essential services.
- Enhance Fund Utilization: Strengthen municipal capacities for effective project planning and incentivize the timely use of allocated grants.
- Scale Public-Private Partnership (PPP) Investments: Develop a pipeline of bankable projects and create risk-sharing mechanisms to attract private sector investments.
- Decouple Project Preparation from Funding: Ensure that infrastructure projects are thoroughly prepared for financial, social, and environmental sustainability before seeking funding.
- Promote Urban Innovation: Establish urban innovation labs and encourage public-private-academic collaborations to foster the adoption of advanced technologies.
- Empower Municipalities: Grant municipalities greater financial autonomy, enabling them to raise capital through municipal bonds and other debt mechanisms.
- Integrated Urban Planning: Align infrastructure development with land use, transport, and housing requirements, while integrating climate resilience into planning.
- Capacity Building: Invest in the training of municipal staff to improve governance and financial management capabilities.
Conclusion
India’s expanding urban population presents a major opportunity for economic growth. However, addressing the financial and structural challenges in urban infrastructure is crucial for harnessing this potential. By adopting a combination of short-term actions, medium-term strategies, and long-term reforms, India can create sustainable, resilient urban infrastructure that meets the growing needs of its cities, fostering inclusive development and long-term prosperity.
RBI brings back 102 tonnes gold from BoE; 60 per cent reserves in India

- 04 Nov 2024
In News:
England over the past two-and-a-half years, reflecting a strategic shift in its approach to safeguarding gold reserves. This move marks a significant increase in the RBI's domestic gold holdings.
Rise in the RBI's Domestic Gold Holdings
- Current Status (September 2024):The RBI's domestic gold reserves have grown to 510.46 metric tonnes, up from 295.82 metric tonnes in March 2022.
- Reduction in Gold Held Abroad:The gold held under the custodianship of the Bank of England has decreased to 324 metric tonnes from 453.52 metric tonnes in March 2022.
- Gold as a Share of Foreign Exchange Reserves:The proportion of gold in India's total foreign exchange reserves increased from 8.15% in March 2024 to 9.32% in September 2024.
Gold Kept in the Bank of England
- Overview of the Bank of England's Gold Vault:The Bank of England is home to one of the largest gold vaults in the world, second only to the New York Federal Reserve, housing around 400,000 bars of gold.
- India’s Gold Held Abroad:The RBI continues to retain 324 metric tonnes of its gold with the Bank of England and the Bank for International Settlements (BIS).
- Additional Gold Management:Around 20 tonnes of gold are managed through gold deposit schemes.
- Strategic Role of London’s Gold Market:Storing gold in London provides immediate access to the global London bullion market, enhancing liquidity for India’s gold assets.
Historical Context of India’s Gold Holdings
- 1991 Balance of Payments Crisis:During a financial crisis in 1991, India had to send 47 tonnes of gold to the Bank of England to secure loans for repaying international creditors.
RBI’s Strategy to Bring Gold Back to India
- Global Trend of Central Banks Buying Gold:Since the imposition of U.S. sanctions on Russia in 2022, central banks globally have been increasing their gold reserves as a hedge against inflation and to reduce reliance on the U.S. dollar. India has outpaced other G20 nations in this trend, surpassing Russia and China in gold purchases.
- De-dollarisation:This shift is part of a broader strategy of de-dollarisation, aiming to diversify away from the U.S. dollar amidst rising gold prices and growing geopolitical tensions.
Significance of Repatriating Gold to India
- Sign of Economic Strength
- Recovery from the 1991 Crisis:The decision to repatriate gold reflects a significant improvement in India's economic position, a stark contrast to the 1991 economic crisis when India had to pledge gold for financial survival.
- Optimizing Financial Resources
- Reducing Storage Costs:Storing gold domestically allows the RBI to save on storage fees paid to foreign custodians, such as the Bank of England.
- Strategic Significance
- Enhanced Resilience Amid Global Instability:By repatriating its gold, India enhances its strategic autonomy and strengthens its economic position in a world of rising uncertainties and currency volatility.
RBI's Capacity to Safeguard Gold Domestically
- Increasing Domestic Storage Capacity:The RBI has been increasing its domestic capacity for gold storage to accommodate rising reserves and reduce dependence on foreign gold safekeeping facilities.
- Current Foreign Exchange Reserves:As of October 2024, India’s total foreign exchange reserves stand at $684.8 billion, sufficient to cover over 11.2 months of imports.
Diversification of Foreign Exchange Reserves
- Mitigating Currency Risks:By increasing gold reserves, India diversifies its foreign exchange holdings, reducing reliance on any single currency and shielding itself from global currency fluctuations and economic volatility.
- Gold as a Stable Asset:Gold serves as a stable asset, providing a safeguard against global economic shocks, and balances India’s reserves portfolio.
Gold as a Hedge against Inflation
- Preserving Wealth amid Inflation:Gold is traditionally viewed as a hedge against inflation, maintaining or appreciating in value when other currencies weaken. By increasing its gold reserves, India positions itself to better withstand the adverse effects of inflation and ensure long-term financial stability.
Conclusion
The repatriation of gold by the RBI reflects a strategic move to bolster India's economic strength and diversify its financial assets. The decision to bring gold back to India not only signifies an improvement in India's economic fundamentals but also aligns with global trends of central banks increasing their gold reserves to ensure long-term stability and reduce reliance on the U.S. dollar.
Analysis of Growing Economic Divide in India

- 29 Oct 2024
Overview
The Economic Advisory Council to the Prime Minister (EAC-PM)'s report titled "Relative Economic Performance of Indian States: 1960-61 to 2023-24" highlights an alarming trend of widening economic disparities across India's states, which is increasingly threatening the principles of federalism and national unity. The findings reveal significant regional imbalances in terms of contributions to the national income, per capita income, and overall economic development. This analysis delves into the key insights from the report and explores the broader implications for India's federal structure, governance, and policy approaches.
Key Insights from the Report
- Regional Economic Disparities:
- Western and Southern States' Dominance: States such as Maharashtra, Gujarat, Tamil Nadu, and Karnataka have consistently outperformed others. These states have benefited from higher private investments, better infrastructure, and a more business-friendly environment. They also enjoy proximity to international markets, especially coastal regions like Gujarat and Tamil Nadu, which have access to ports and export markets.
- Underperformance of Northern and Eastern States: On the other hand, northern states (with exceptions like Delhi and Haryana) and eastern states like Bihar, Odisha, and West Bengal lag behind in economic performance. These regions face challenges such as poor infrastructure, low levels of investment, and weak governance structures, which hinder their growth potential.
- Impact of Liberalization (1991):
- The 1991 economic reforms marked a shift toward market-oriented growth, benefiting states that were already more industrialized or had better urban infrastructure. Southern states, in particular, adapted well to the liberalized environment, attracting higher levels of private investment and expanding their economies.
- The liberalization process disproportionately favored urban centers like Delhi, Mumbai, Chennai, and Bengaluru, where investments were channelized into growing service sectors, technology, and industries, creating a feedback loop of wealth accumulation in these hubs. Meanwhile, the hinterland remained underdeveloped due to insufficient public investment and the lack of private sector interest in these regions.
- Investment Disparities:
- Private Investment: Wealthier states attract a disproportionate share of private investment, which is driven by profitability and market opportunities. These states have better infrastructure, which reduces transaction costs and increases returns on investment. In contrast, underdeveloped states struggle to attract investment due to poor governance, inadequate infrastructure, and perceived higher risks.
- Public Investment: While the public sector still plays a role in investment, the New Economic Policies (NEP) since 1991 have shifted the focus towards private sector-driven growth. This has further widened the investment gap, as the poorer states receive less public investment relative to their needs.
- Role of Infrastructure and Governance:
- The availability and quality of infrastructure are significant determinants of economic performance. States with better roads, energy supply, ports, and communication networks tend to attract more investments. Additionally, good governance, characterized by reduced corruption, better policy implementation, and transparency, also plays a critical role in fostering economic development.
- In contrast, states with weaker governance structures and poor infrastructure struggle to create an enabling environment for businesses, further compounding regional disparities.
- Impact on Federalism:
- The growing economic divide is leading to tensions between the Centre and state governments, particularly in wealthier states that contribute significantly to national income but feel short-changed in resource allocation. These states argue that they are not receiving a fair share of national resources in return for their contributions, leading to growing dissatisfaction with the federal system.
- The tension is exacerbated by political factors, such as accusations from opposition-led states that the Centre uses public investment to favor states aligned with the ruling party. The growing perception of politicization of resource allocation has the potential to undermine the spirit of cooperative federalism.
Structural Causes of Regional Inequality
- Economic and Investment Magnetism:
- Wealthier states attract more private investments, as they offer better returns due to established markets, skilled labor, and urbanization. Cities like Mumbai, Delhi, and Bengaluru serve as economic magnets, drawing talent, technology, and capital, which further consolidates their economic dominance.
- In contrast, states without such economic hubs or access to global markets struggle to attract investment. The absence of urban agglomerations and the concentration of wealth and resources in a few states perpetuate regional disparities.
- Policy and Investment Bias:
- Post-liberalization policies have disproportionately benefited the organized sector, often at the expense of the unorganized sector, which is more prevalent in poorer states. The emphasis on industrial growth and infrastructure development has largely bypassed the rural and informal sectors, which are critical in underdeveloped states.
- The organized sector has also benefited from government support, such as tax concessions and subsidized infrastructure, which have enabled these industries to thrive in already developed regions. This has widened the gap between the haves and the have-nots.
- Cronyism and the Black Economy:
- Crony capitalism and the prevalence of the black economy in poorer states further exacerbate regional imbalances. In some cases, political patronage and corruption divert resources and investments from areas that need them most. This weakens the investment climate, especially in states with higher levels of informal and illegal economic activity.
Implications for Federalism
The growing economic disparity poses a serious threat to India's federal structure. The increasing dissatisfaction of wealthier states with the current fiscal arrangements and the growing demand for fairer resource allocation challenge the spirit of cooperative federalism. A well-functioning federal system relies on equitable distribution of resources and opportunities for all regions to develop.
Policy Recommendations
To address these disparities and strengthen India's federal framework, several policy measures need to be implemented:
- Enhancing Governance and Infrastructure in Lagging States:
- Improved governance and reducing corruption are essential in attracting both private and public investments. Additionally, there must be a focus on developing critical infrastructure, such as roads, energy, and health facilities, which are essential for economic growth.
- States need to increase public investment in sectors like education, healthcare, and social security to improve human capital and productivity.
- Focus on the Unorganized Sector:
- A significant portion of the labor force in poorer states is employed in the unorganized sector. Policies should aim to formalize this sector by providing social security benefits, improving labor rights, and increasing productivity through skill development. This could help raise incomes and stimulate local demand, attracting more private investment.
- Balancing the Organized and Unorganized Sectors:
- While the organized sector has benefited from liberalization, more attention should be given to the unorganized sector, which forms the backbone of the economy in many poorer states. A balanced approach to economic growth, which includes both organized and unorganized sectors, can help reduce disparities.
- Shifting Focus from Urban Centers to Hinterlands:
- Private sector investment must be incentivized in underdeveloped regions through tax breaks, subsidies, and targeted infrastructure projects. This will encourage businesses to expand beyond the major urban centers, thus promoting a more balanced distribution of economic activities.
Conclusion
The widening economic divide in India, as revealed by the EAC-PM report, poses a significant challenge to the country's federalism and unity. To ensure inclusive and balanced development, policy reforms must focus on reducing regional disparities by improving governance, infrastructure, and investment in lagging states. A shift towards equitable growth, addressing the needs of both the organized and unorganized sectors, is essential to promoting national cohesion and ensuring sustainable economic progress across all regions.
Pradhan Mantri Mudra Yojana (PMMY)

- 27 Oct 2024
Introduction
The Pradhan Mantri Mudra Yojana (PMMY) was launched by Prime Minister Narendra Modi on April 8, 2015, with the aim of providing financial support to non-corporate, non-farm small and micro enterprises in India. Through this initiative, loans are provided to individuals and small businesses who are unable to access formal institutional finance.
In the Union Budget 2024-25, Finance Minister Nirmala Sitharaman announced an increase in the loan limit under PMMY from ?10 lakh to ?20 lakh, with the introduction of a new loan category, Tarun Plus, aimed at fostering growth in the entrepreneurial sector.
Key Features of the Pradhan Mantri Mudra Yojana
Loan Limit Increase
- Loan Limit Raised: The loan limit has been increased from ?10 lakh to ?20 lakh for eligible entrepreneurs.
- New Loan Category: The newly introduced Tarun Plus category caters to entrepreneurs who have previously availed and successfully repaid loans under the Tarun category.
- Credit Guarantee: The Credit Guarantee Fund for Micro Units (CGFMU) will cover these enhanced loans, further ensuring the security of micro-enterprises.
Categories of MUDRA Loans
PMMY provides collateral-free loans through financial institutions like Scheduled Commercial Banks, Regional Rural Banks (RRBs), Small Finance Banks (SFBs), Non-Banking Financial Companies (NBFCs), and Micro Finance Institutions (MFIs). These loans are provided for income-generating activities in sectors like manufacturing, trading, services, and allied agriculture activities.
Objectives of PMMY
- Financial Inclusion: PMMY targets marginalized and socio-economically neglected sections of society, promoting financial inclusivity.
- Support to Small Businesses: By providing affordable loans, the scheme encourages small-scale entrepreneurs, particularly women and minority groups, to establish and expand their businesses.
- Fostering Entrepreneurship: PMMY aims to unlock the potential of India’s entrepreneurial spirit, especially in rural and underserved areas.
MUDRA: The Institutional Backbone
Role of Micro Units Development & Refinance Agency Ltd. (MUDRA)
MUDRA is the primary institution set up by the Government of India to manage and implement the Mudra Yojana. It acts as a refinancing agency that provides financial support to small and micro-enterprises by working through financial intermediaries, such as banks and micro-finance institutions.
Funding Sources
- Scheduled Commercial Banks
- Regional Rural Banks (RRBs)
- Small Finance Banks (SFBs)
- Non-Banking Financial Companies (NBFCs)
- Micro Finance Institutions (MFIs)
Application Process
Applicants can avail loans through any of the aforementioned financial institutions or apply online via the Udyami Mitra Portal.
Benefits of Pradhan Mantri Mudra Yojana
- Collateral-free Loans: No security is required to obtain loans, which reduces the financial burden on borrowers.
- Easily Accessible: PMMY loans are available across India, making them accessible to entrepreneurs in both rural and urban areas.
- Quick and Flexible Loans: Loans can be disbursed quickly with flexible repayment terms (up to 7 years).
- Empowering Women Entrepreneurs: The scheme offers special incentives for women entrepreneurs, helping them to establish and grow their businesses.
- Support to Rural Areas: Special emphasis on empowering rural enterprises and reducing regional disparities.
- MUDRA Card: The MUDRA Card is a RuPay debit card that allows borrowers to access funds through an overdraft facility, enhancing liquidity for businesses.
- No Default Penalty: In case of loan defaults due to unforeseen circumstances, the government will step in to reduce the burden on entrepreneurs.
Categories of Loans Under PMMY
1. Shishu Category: Loans up to ?50,000
- Targeted at micro-enterprises at the initial stage of their business journey.
2. Kishore Category: Loans between ?50,000 and ?5 lakh
- Targeted at enterprises looking to expand their operations and upgrade their infrastructure.
3. Tarun Category: Loans between ?5 lakh and ?10 lakh
- For established businesses that are in need of funds to scale up.
4. Tarun Plus: Loans between ?10 lakh and ?20 lakh
- A new category designed for entrepreneurs who have repaid loans under the Tarun category and wish to further expand their business.
Achievements of PMMY (2023-24)
- Total Loans Sanctioned: ?5.4 trillion across 66.8 million loans in FY 2023-24.
- Loans Disbursed: Significant amounts were disbursed under each category:
- Shishu: ?1,08,472.51 crore
- Kishore: ?1,00,370.49 crore
- Tarun: ?13,454.27 crore
- Women Borrowers: A large share of loans have gone to women entrepreneurs, ensuring gender inclusivity.
- Minority Borrowers: The scheme also emphasizes financial empowerment of minority communities.
- NPA Reduction: The Non-Performing Assets (NPA) in Mudra loans have reduced to 3.4% in FY 2024, compared to higher levels in earlier years.
Digital Tools and Support Systems
MUDRA MITRA App
The MUDRA MITRA mobile app helps users access information about the PMMY scheme, loan application procedures, and other resources. The app is available for download on Google Play Store and Apple App Store.
Online Loan Application
Entrepreneurs can apply for loans online via portals such as PSBloansin59minutes and Udyamimitra, providing greater convenience and accessibility.
Steps to Improve Implementation
- Handholding Support: Assistance in submitting loan applications is available for applicants.
- Intensive Awareness Campaigns: The government conducts publicity campaigns to raise awareness about PMMY.
- Simplified Loan Process: The loan application forms have been simplified to encourage wider participation.
- Performance Monitoring: Regular monitoring of PMMY implementation to ensure its success.
- Interest Subvention: A 2% interest subvention is offered for prompt repayment of Shishu loans.
Conclusion
The Pradhan Mantri Mudra Yojana has been a transformative scheme in fostering entrepreneurship and ensuring financial inclusion for small and micro-businesses across India. With the recent increase in loan limits and the addition of the Tarun Plus category, the scheme continues to empower emerging entrepreneurs and provides a crucial lifeline for business growth and sustainability. By supporting women, minorities, and new entrepreneurs, PMMY has contributed significantly to economic upliftment and inclusive growth in the country.
What are the stress factors for Indian Railways?

- 22 Oct 2024
In News:
On October 17, eight coaches of the Agartala-Lokmanya Tilak Express derailed in Assam with no casualties. On October 11, a passenger train rear-ended a stationary goods train near Chennai, also with no casualties. Indian trains have been involved in multiple accidents of late. The Balasore accident on June 2, 2023, had the greatest death toll, more than 275, yet pressure on the Railways to improve safety competes with pressures straining its subsistence.
Railway Accident Trends
- Decline in Accidents Over Time:
- From 1,390 accidents per year in the 1960s, railway accidents have reduced to about 80 accidents per year in the last decade.
- Recent Consequential Accidents:
- 34 accidents in 2021-2022
- 48 accidents in 2022-2023
- 40 accidents in 2023-2024
- Primary Causes of Accidents:
- 55.8% due to staff errors (railway personnel).
- 28.4% due to non-staff errors.
- 6.2% due to equipment failure.
- Role of Signalling Failures:
- Major accidents, such as Balasore and Kavaraipettai, were attributed to signalling system failures.
Key Safety Technologies and Measures
- Kavach System:
- Kavach is an automatic train protection system designed to prevent collisions by monitoring train positions and activating alarms or braking.
- As of February 2024, Kavach was implemented on only 2% (1,465 route km) of the railway network, limiting its effectiveness.
- Signalling System Overhaul:
- Outdated and faulty signalling systems contribute significantly to accidents. Both Balasore and Kavaraipettai incidents were linked to failures in signalling infrastructure.
Financial Strain on Indian Railways
- Operating Ratio (OR):
- The Operating Ratio (OR) in 2024-2025 is estimated to be ?98.2, indicating that the Railways spends ?98.2 for every ?100 earned.
- A higher OR reduces available funds for safety improvements and infrastructure upgrades.
- Budgetary Constraints:
- The 2023-24 budget showed a 7.2% reduction in capital outlay for track renewal and a 96% decrease in the Depreciation Reserve Fund, which is used to replace aging assets.
- Revenue Imbalance:
- Freight services account for 65% of Railways’ revenue but face capacity constraints, with 30% of the network operating at over 100% capacity.
- Passenger services, however, continue to incur significant losses, with ?68,269 crore loss in 2021-22.
Challenges in Rail Infrastructure
- Slow Infrastructure Development:
- The government's Dedicated Freight Corridors (DFCs), intended to alleviate congestion, are severely delayed:
- The Eastern DFC is the only fully operational corridor.
- Other corridors, including the Western DFC and additional planned routes, remain incomplete.
- Track and Equipment Maintenance:
- Ongoing delays in upgrading and maintaining essential infrastructure (tracks, wagons, signalling) contribute to the rising number of accidents.
Loco Pilot Working Conditions
- Extended Working Hours:
- Loco pilots often work 12-hour shifts due to manpower shortages, leading to fatigue and increased risk of human error.
- Stress and exhaustion are significant contributors to accidents caused by human error, including Signal Passed at Danger (SPAD).
Recommendations for Improving Railway Safety
- Loco Pilot Vacancies:Immediate recruitment to fill the 18,799 vacant loco pilot positions to prevent overworking and reduce fatigue-related errors.
- Expand Kavach Deployment:Accelerate the nationwide installation of the Kavach system, particularly on high-risk and high-traffic routes, to enhance safety.
- Complete Dedicated Freight Corridors (DFCs):Expedite the completion of DFCs to ease congestion and increase freight movement efficiency.
- Independent Railway Safety Authority:Establish an independent Railway Safety Authority with statutory powers, as recommended by the Kakodkar Committee (2012), to enforce safety standards and monitor implementation.
- Improve Signal Infrastructure:Invest in advanced and reliable signalling systems to prevent errors stemming from outdated or malfunctioning infrastructure.
- Regulate Working Hours:Enforce strict work hour limits to reduce fatigue among railway staff and ensure proper rest between shifts.
- Strengthen Trackside Infrastructure:Install fencing along tracks in high-risk areas to prevent cattle run-overs, a common cause of derailments in rural and semi-urban areas.
Conclusion
- Indian Railways faces a complex set of challenges, balancing safety requirements with financial constraints. Despite technological advancements like Kavach, its limited deployment and outdated infrastructure continue to present significant risks.
- A holistic approach to reform is needed, including addressing manpower shortages, upgrading safety technologies, and investing in infrastructure development. This will be essential for reducing accidents, improving safety, and ensuring the long-term sustainability of India’s vast railway network.